Scatterplot
scatter_plot(scatterplot, outcome = c("Benefit", "Risk"))How to read
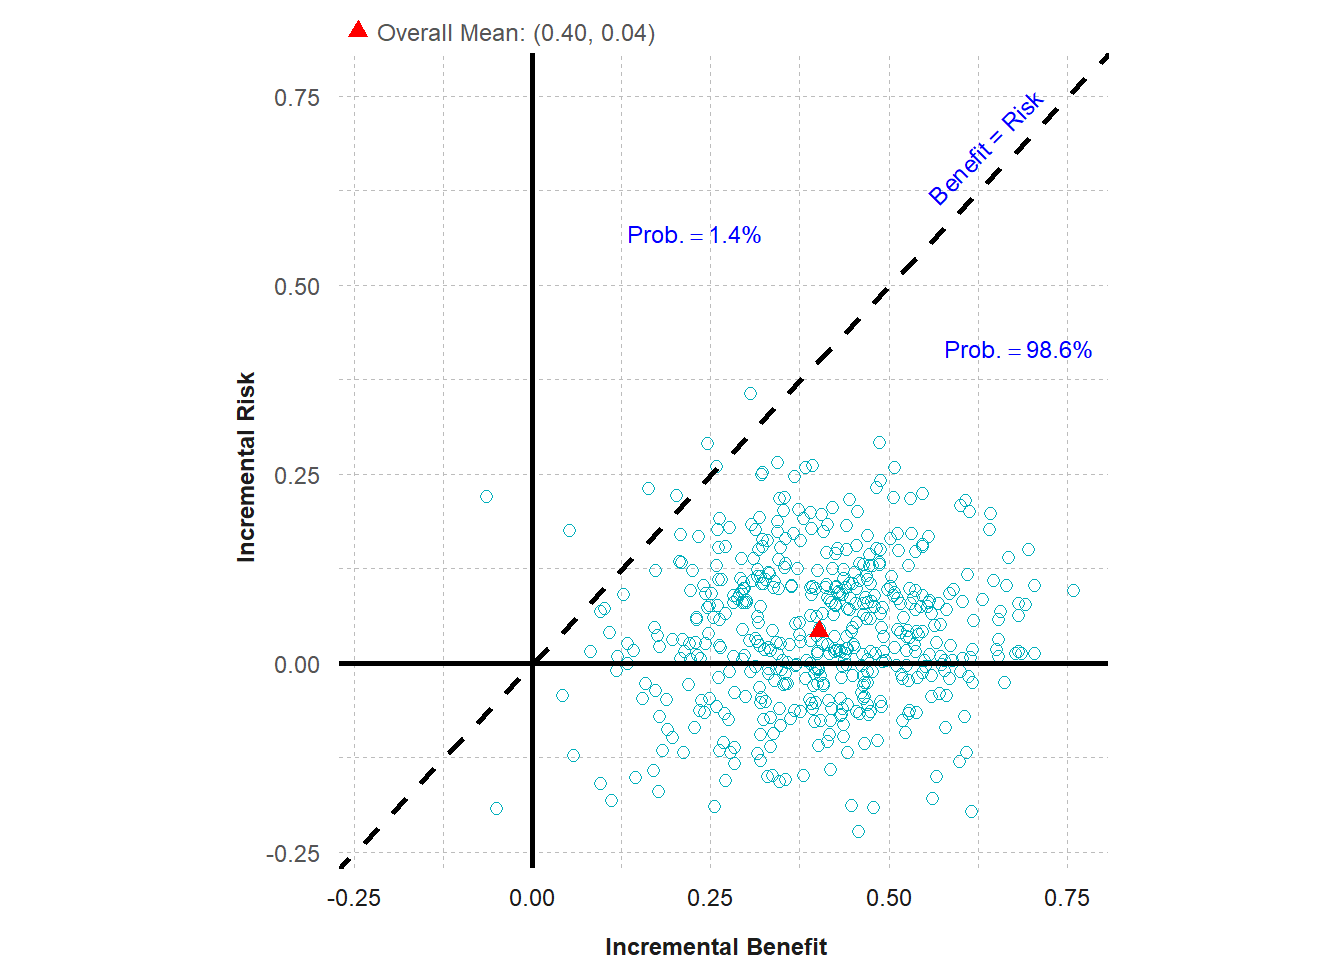
Each point indicates the predictive incremental probabilities associated with experiencing a benefit and a risk. The probabilities are estimated using logistic regression models with demographic and baseline covariates, but separately for one benefit and one risk.
The X-axis depicts the predicted incremental benefit.
The Y-axis depicts the predicted incremental risk.
The red triangle indicates the overall mean of predictive incremental probabilities associated with experiencing a benefit and a risk.
The diagonal threshold depicts the benefit and risk having equal weight.
As the slope increases, the benefit receives more weight than the risk, meaning subjects are willing to accept much more risk in exchange for more benefit.
For subjects in the upper left area, the risk exceeds the benefit.
For subjects in the lower right area, the benefit exceeds the risk.
Key Conclusions:
- The scatter plot of predictive incremental probabilities illustrates that 98.6% of subjects have benefit-risk predictive incremental probabilities that fall within the acceptance region, defined as the region below the diagonal threshold. Besides displaying subject variability, it indicates which subjects are most likely to benefit from the investigational drug.