Cumulative Excess Plot
gensurv_combined(
df_plot = cumexcess, subjects_pt = 500, visits_pt = 6,
df_table = cumexcess, fig_colors_pt = colfun()$fig13_colors,
rel_heights_table = c(1, 0.4),
legend_position_p = c(-0.2, 1.45),
titlename =
"Cumulative Excess # of Subjects w/ Events(per 100 Subjects)"
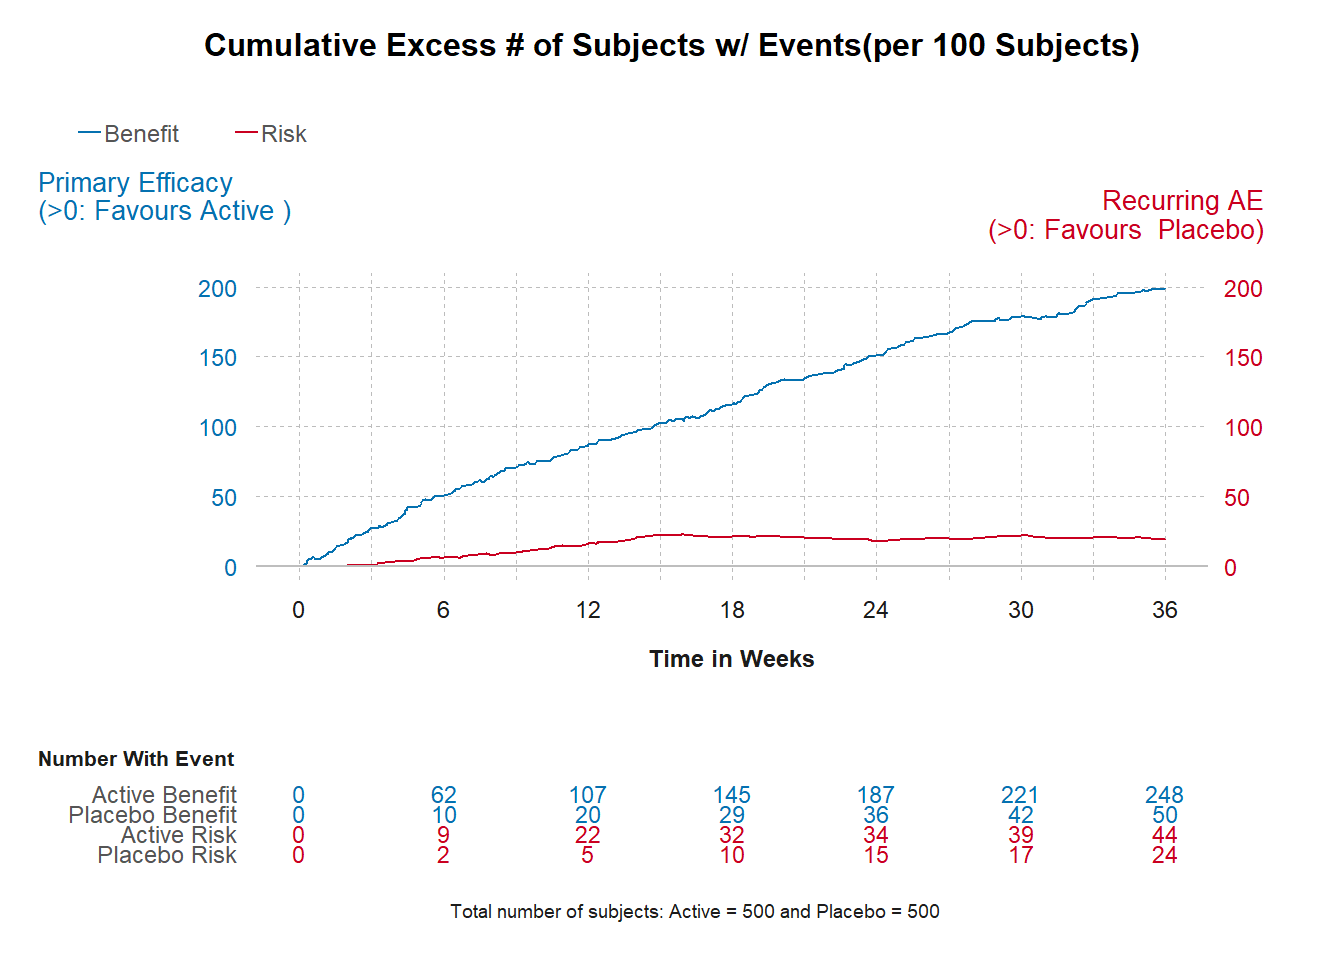
)How to read
The Y-axis displays the cumulative excess incidence per 100 subjects, ranging from 0 to maximum observed value.
The X-axis displays the study week, ranging from 0 to end of follow-up.
The number of subjects with events are displayed below the X-axis, by either benefit or risk and by either active treatment or placebo group.
The blue trend line represents the difference in cumulative incidence of the benefit outcome (e.g., efficacy) between the active treatment and placebo groups.
The red trend line represents the difference in cumulative incidence of the risk outcome (e.g., adverse event) between the active treatment and placebo groups.
The cumulative incidence rate per 100 subjects is calculated by (1) counting the number of subjects who have experience one or more occurrences of the event, and (2) dividing the count by 100 subjects.
The cumulative excess number of subjects with an event per 100 subjects is calculated by subtracting the rate for placebo from the rate for active treatment.
Unlike a similar looking Kaplan-Meier plot, the trend line for excess incidence can either increase or decrease from one time point to the next.
If the line for benefit is greater than 0, this indicates the active treatment is favored over the placebo.
If the line risk is greater than 0, this indicates the placebo arm is favored over the active treatment.
Key Conclusions:
- The Cumulative Excess plot assessed whether the binary events for a benefit and risk occur concurrently and whether the profile is sustainable. The two positive trends indicate that both benefit and risk are higher for the active drug than placebo, but not at the same rate. This is an ideal scenario where the benefit increased with drug exposure while the risk plateaued.