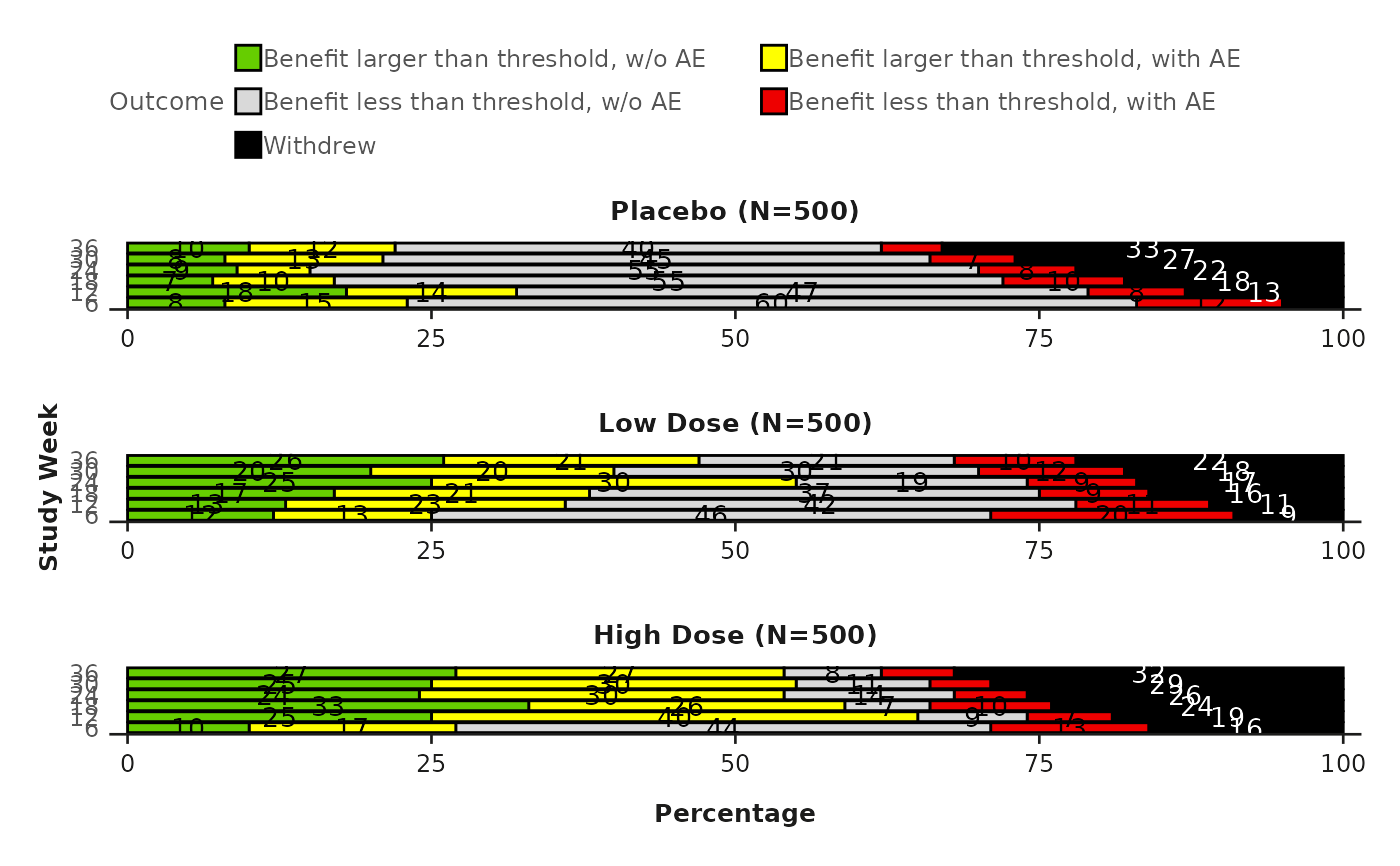
Stacked Bar Chart
stacked_barchart.RdStacked Bar Chart
Arguments
- data
dataframea data frame with a minimum of 4 variables named the following:usubjid: unique subject ID
visit: visit ID
trt: treatment group
brcat: composite benefit-risk category
- chartcolors
vectora vector of colors, the same number of levels as the brcat variable- ylabel
charactery label name, default is "Visit"- base_font_size
Numeric; base font size in points for all text elements in the plot (default: 9).
Examples
stacked_barchart(
  data = comp_outcome,
  chartcolors = colfun()$fig12_colors,
  ylabel = "Study Week"
)