Create a scatterplot from a given dataframe.
scatter_plot.RdCreate a scatterplot from a given dataframe.
Usage
scatter_plot(
  df_diff,
  outcome,
  mab,
  mar,
  ellipse_type = "t",
  ellipse_level = 0.95,
  marginal_type = "densigram",
  fig_colors = colfun()$fig11_colors,
  base_font_size = 9
)
Arguments
- df_diff
A dataframe containing two vectors, each of which displays the difference between incremental probabilities in active and control effects for a specified outcome.
- outcome
A vector of two strings that describes the two outcomes associated with the difference in active and control effects, where the first outcome corresponds to
diff1and the second todiff2.- mab
A numerical value that specifies the mimimum acceptable benefit.
- mar
A numerical value that specifies the maximum acceptable risk.
- ellipse_type
Type of confidence ellipse. The default "t" assumes a multivariate t-distribution, and "norm" assumes a multivariate normal distribution. "euclid" draws a circle with the radius equal to level, representing the euclidean distance from the center. If ellipse_type = NULL, the confidence ellipse will not be showed.
- ellipse_level
The confidence level at which to draw an ellipse (default is 0.95). If type = "euclid", the radius of the circle to be drawn.
- marginal_type
Type of marginal plot to show. One of: density, histogram, boxplot, violin, densigram (a 'densigram' is when a density plot is overlaid on a histogram). If marginal_type = NULL, the marginal plot will not be showed. By default, densigram is displayed.
- fig_colors
Allows user to change colors of the figure (defaults are provided). Must be a vector of length 3, with the first color corresponding to the scatter plot points, the second corresponding to the overall mean, and third to the written probability text color.
- base_font_size
Numeric; base font size in points for all text elements in the plot (default: 9).
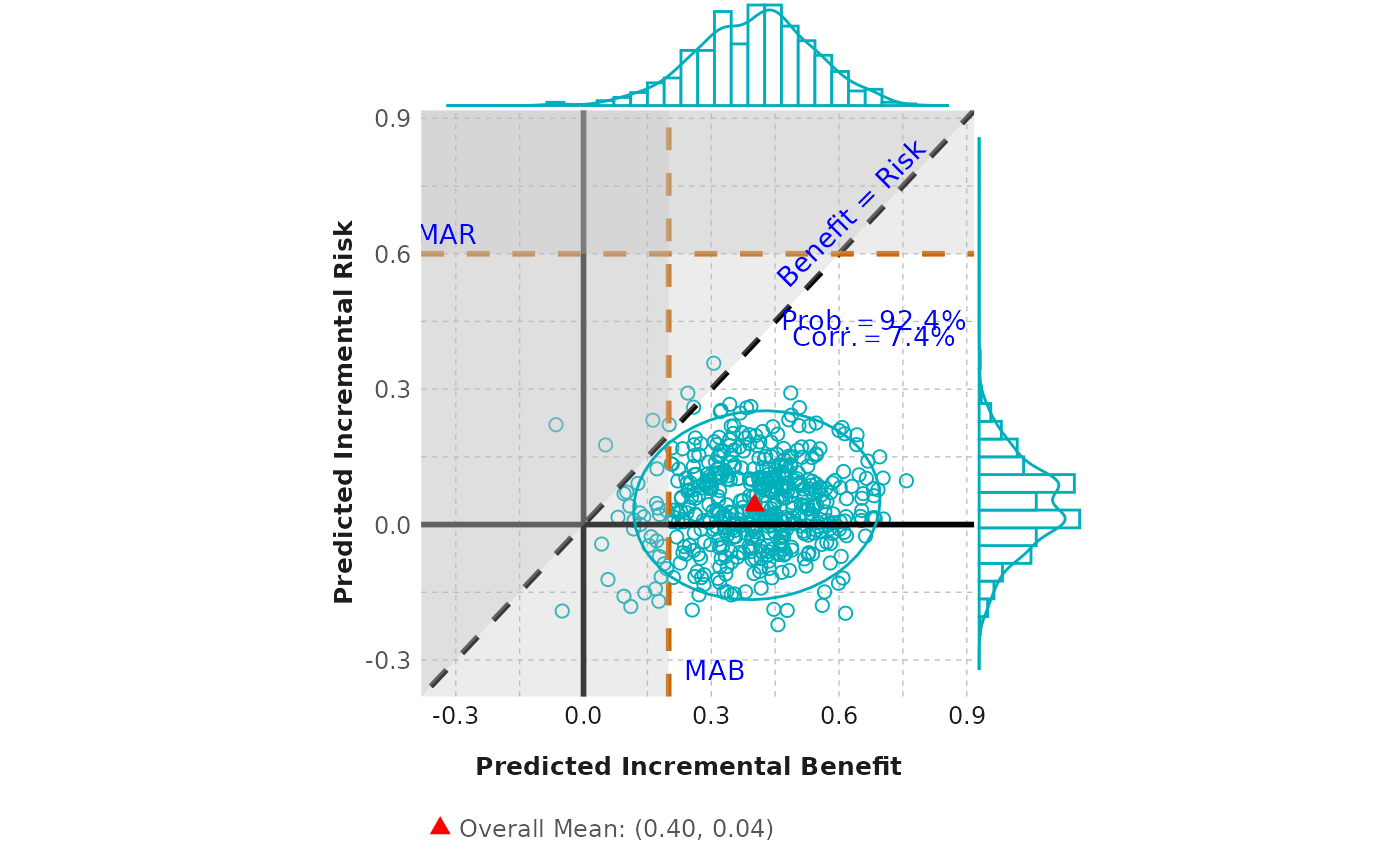
Examples
outcome <- c("Benefit", "Risk")
scatter_plot(scatterplot, outcome, mab = 0.2, mar = 0.6)