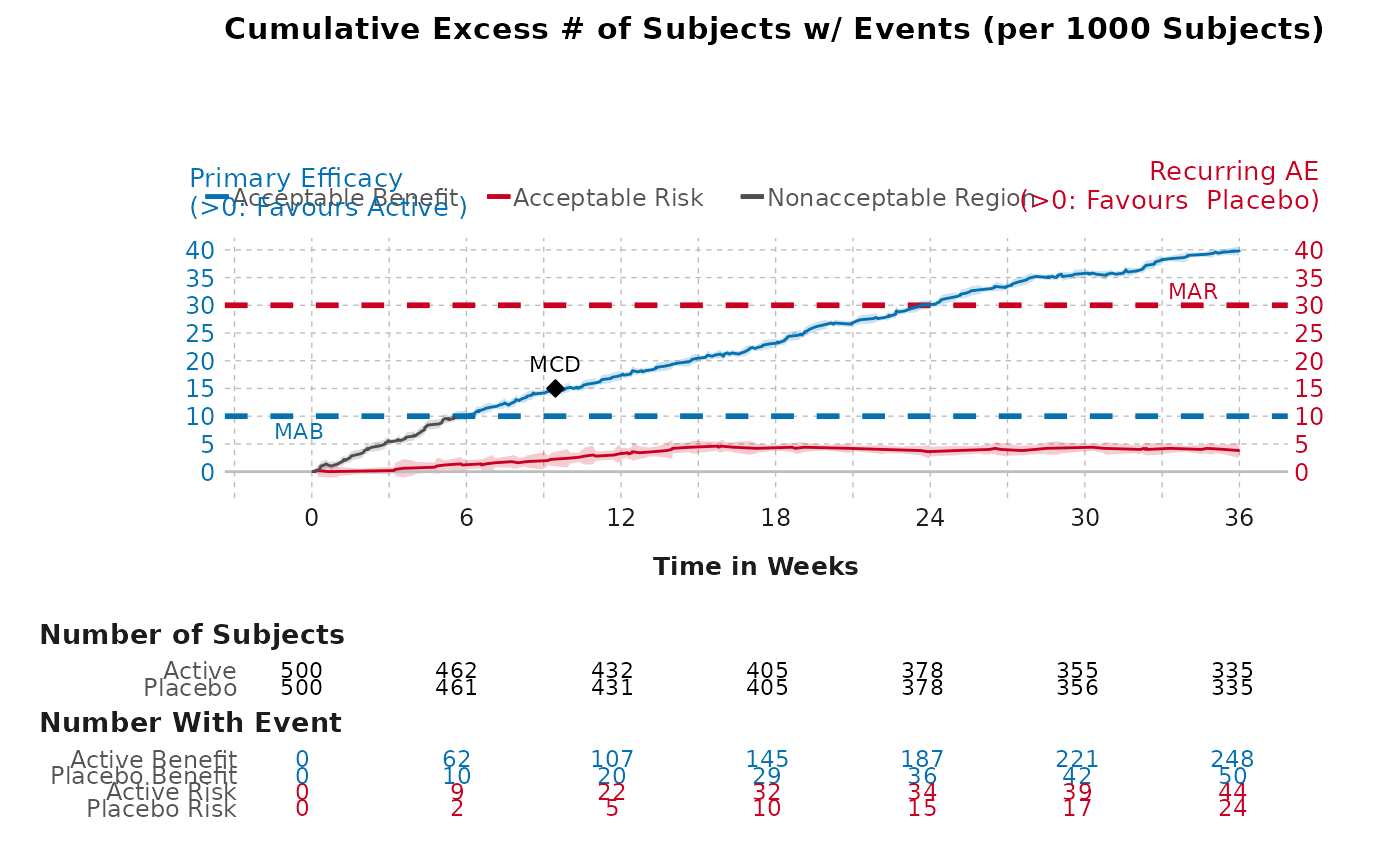
Combine the cumulative excess plot and corresponding table into one figure
gensurv_combined.RdCombine the cumulative excess plot and corresponding table into one figure
Usage
gensurv_combined(
  df_plot,
  df_table,
  subjects_pt,
  visits_pt,
  fig_colors_pt = c("#0571b0", "#ca0020"),
  titlename_p = paste("Cumulative Excess # of Subjects w/ Events", "(per 1000 Subjects)"),
  mar,
  mab,
  mcd,
  rel_adjust = 0.12,
  rel_heights_table = c(1, 0.4),
  ben_name_p = "Primary Efficacy",
  risk_name_p = "Recurring AE",
  legend_position_p = c(-0.03, 1.15),
  base_font_size = 9
)
Arguments
- df_plot
A dataframe with 6 variables named the following:
eventtime: A vector of time points at which an event occurred.
diff: A vector containing the difference in active and control effects.
obsv_duration: A variable that specifies the duration of the observational period (numerical).
obsv_unit: A variable that specifies the unit for the duration of the observational period (this is a non-numerical input).
outcome: A vector containing whether the outcome is a "Benefit" or "Risk".
eff_diff_lbl: A vector containing the label for effect difference.
- df_table
A dataframe with 6 variables named the following:
obsv_duration: A variable that specifies the duration of the observational period (numerical).
n: A vector containing a number of subjects who experienced an event at a given time (numerical).
effect: specifies between an active or control effect.
outcome: specifies whether the an outcome should be classified as a "Benefit" or "Risk" (this must have either "Benefit" or "Risk" as values).
eff_code: 0 for control and 1 for active effect.
subjects: A vector containing the total number of active/placebo subjects in the study at a given time.
- subjects_pt
A numerical input that specifies the baseline proportion of subjects in the study.
- visits_pt
A numerical input that is the length between observational periods.
- fig_colors_pt
Allows user to change the colors of the figure (defaults are provided). Must be vector of length 2, with color corresponding to benefit first and risk second.
- titlename_p
Allows user to change the documentation of title (default is provided)
- mar
The maximum acceptable risk for the treatment, as discussed by the team, must be numerical.
- mab
The minimum acceptable benefit for the treatment, as discussed by the team, must be numerical.
- mcd
The minimum clinically important difference of the treatment, as discussed by the team, must be numerical.
- rel_adjust
Allows user to specify the figure and table alignment. Must be a single number, corresponding to the space to the left of the figure, relative to the figure's width (denoted as 1).
- rel_heights_table
Elements for fig vs table size.
- ben_name_p
Allows user to specify benefit of interest (default is provided).
- risk_name_p
Allows user to specify risk of interest (default is provided).
- legend_position_p
Allows user to specify legend position. Must be a vector of length 2, with the first value corresponding to the position of the legend relative to the x-axis, and the second corresponding to the position of the legend relative to the y-axis (numeric).
- base_font_size
Numeric; base font size in points for all text elements in the plot (default: 9).
Examples
gensurv_combined(
  df_plot = cumexcess, subjects_pt = 100, visits_pt = 6,
  df_table = cumexcess, fig_colors_pt = colfun()$fig13_colors,
  mar = 30, mab = 10, mcd = 15
)
#> Warning: Using `size` aesthetic for lines was deprecated in ggplot2 3.4.0.
#> ℹ Please use `linewidth` instead.
#> ℹ The deprecated feature was likely used in the valueJudgementCE package.
#>   Please report the issue to the authors.
#> Warning: `aes_string()` was deprecated in ggplot2 3.0.0.
#> ℹ Please use tidy evaluation idioms with `aes()`.
#> ℹ See also `vignette("ggplot2-in-packages")` for more information.
#> ℹ The deprecated feature was likely used in the valueJudgementCE package.
#>   Please report the issue to the authors.
#> Ignoring unknown labels:
#> • titles : "Number of Subjects"
#> Ignoring unknown labels:
#> • titles : "Number With Event"