Divergent Stacked Bar Chart
divergent_stacked_barchart.RdDivergent Stacked Bar Chart
Usage
divergent_stacked_barchart(
  data,
  chartcolors,
  favcat,
  unfavcat,
  ylabel = "Visit",
  base_font_size = 9
)
Arguments
- data
dataframea data frame with a minimum of 4 variables named the following:usubjid: unique subject ID
visit: visit ID
trt: treatment group
brcat: composite benefit-risk category
- chartcolors
vectora vector of colors, the same number of levels as the brcat variable- favcat
vectora vector of favorable categories in the desired plot order- unfavcat
vectora vector of unfavorable categories in the desired plot order- ylabel
charactery label name, default is "Visit"- base_font_size
Numeric; base font size in points for all text elements in the plot (default: 9).
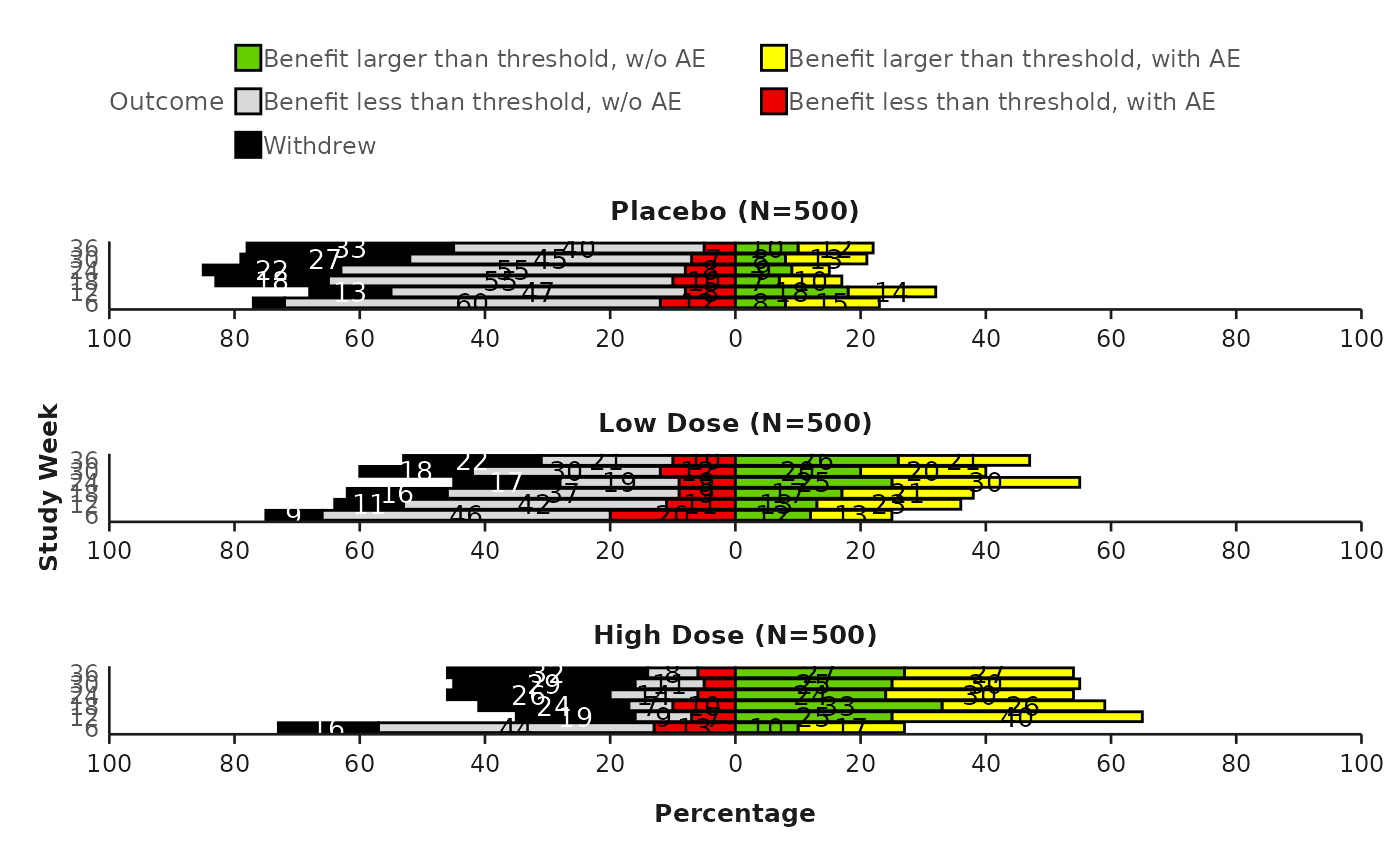
Examples
divergent_stacked_barchart(
  data = comp_outcome,
  chartcolors = colfun()$fig12_colors,
  favcat = c("Benefit larger than threshold, with AE",
  "Benefit larger than threshold, w/o AE"),
  unfavcat = c("Withdrew",
  "Benefit less than threshold, w/o AE",
  "Benefit less than threshold, with AE"),
  ylabel = "Study Week"
)
#> Warning: The `size` argument of `element_line()` is deprecated as of ggplot2 3.4.0.
#> ℹ Please use the `linewidth` argument instead.
#> ℹ The deprecated feature was likely used in the valueJudgementCE package.
#>   Please report the issue to the authors.
#> Warning: The `size` argument of `element_rect()` is deprecated as of ggplot2 3.4.0.
#> ℹ Please use the `linewidth` argument instead.
#> ℹ The deprecated feature was likely used in the valueJudgementCE package.
#>   Please report the issue to the authors.