Stacked Bar Chart
stacked_barchart(data, chartcolors, xlabel = "Visit")Arguments
- data
dataframea data frame with a minimum of 4 variables named the following:usubjid: unique subject ID
visit: visit ID
trt: treatment group
brcat: composite benefit-risk category
- chartcolors
vectora vector of colors, the same number of levels as the brcat variable- xlabel
characterx label name, default is "Visit"
Value
a ggplot object
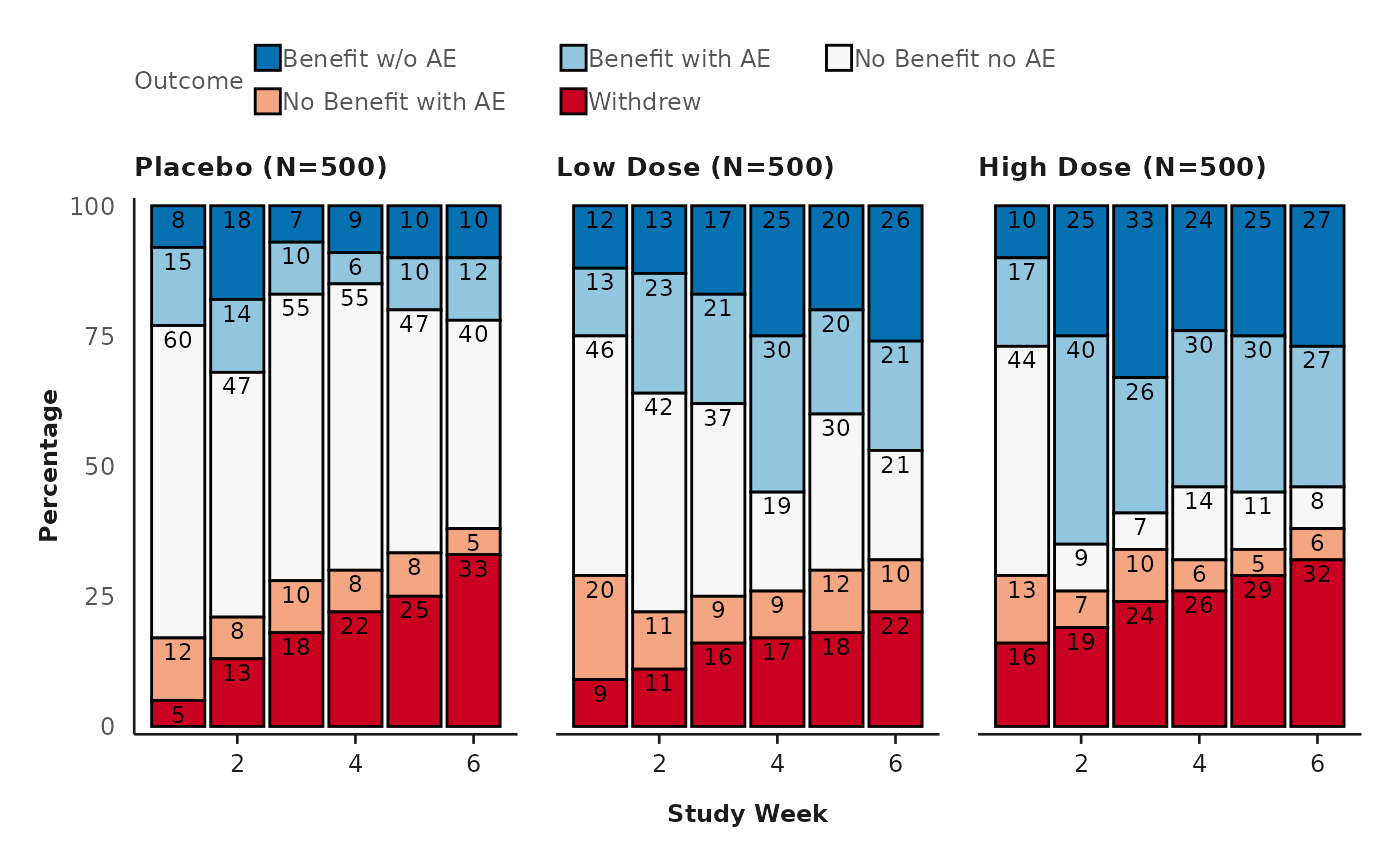
Examples
stacked_barchart(
data = comp_outcome,
chartcolors = colfun()$fig12_colors,
xlabel = "Study Week"
)
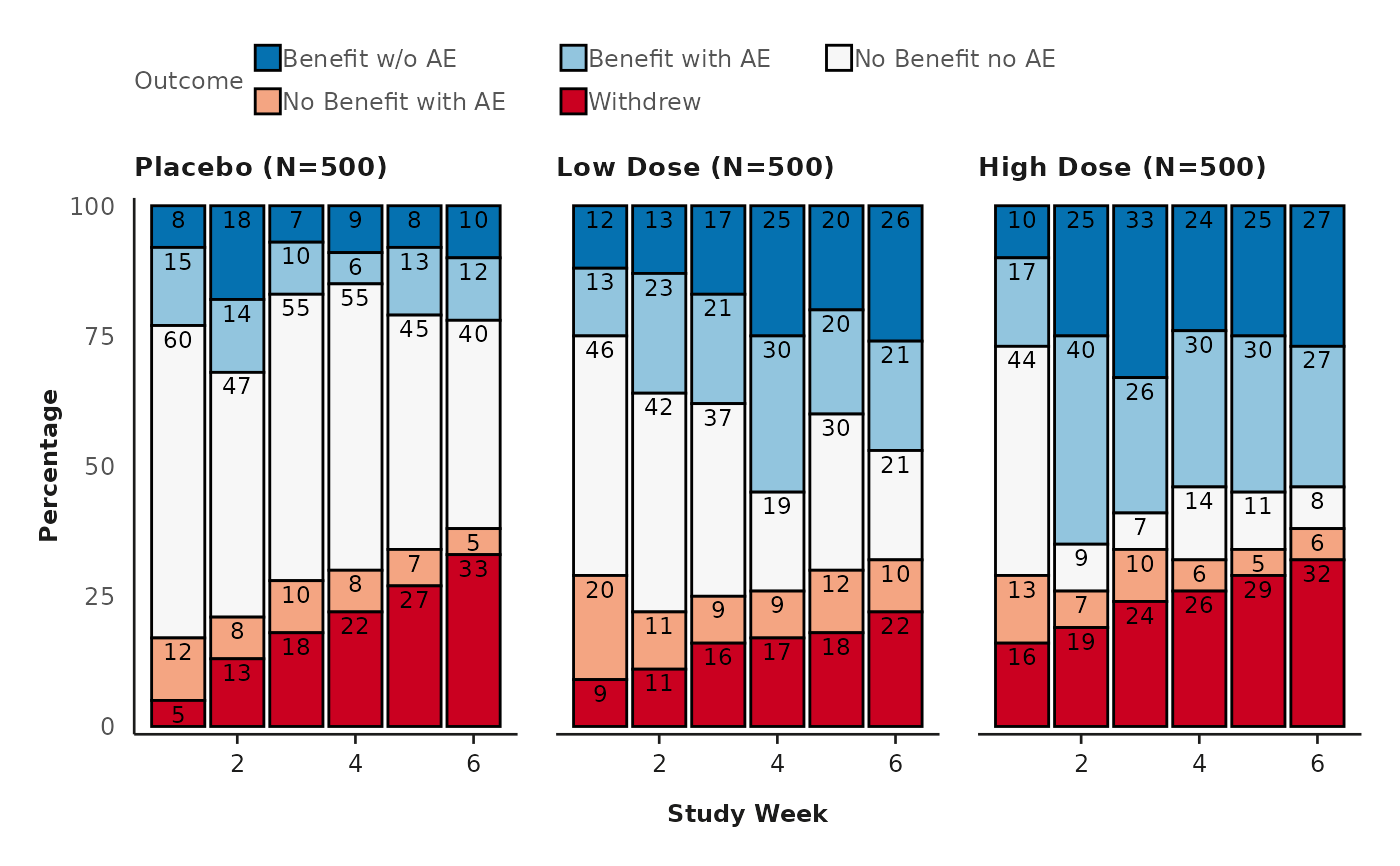 # unequal number of subjects across treatments
comp_outcome2 <- comp_outcome[
(comp_outcome$trtn == 1 & comp_outcome$usubjid %in% c(1:40)) |
(comp_outcome$trtn == 2 & comp_outcome$usubjid %in% c(101:160)) |
(comp_outcome$trtn == 3 & comp_outcome$usubjid %in% c(201:250)),
]
stacked_barchart(
data = comp_outcome2,
chartcolors = colfun()$fig12_colors,
xlabel = "Study Week"
)
# unequal number of subjects across treatments
comp_outcome2 <- comp_outcome[
(comp_outcome$trtn == 1 & comp_outcome$usubjid %in% c(1:40)) |
(comp_outcome$trtn == 2 & comp_outcome$usubjid %in% c(101:160)) |
(comp_outcome$trtn == 3 & comp_outcome$usubjid %in% c(201:250)),
]
stacked_barchart(
data = comp_outcome2,
chartcolors = colfun()$fig12_colors,
xlabel = "Study Week"
)
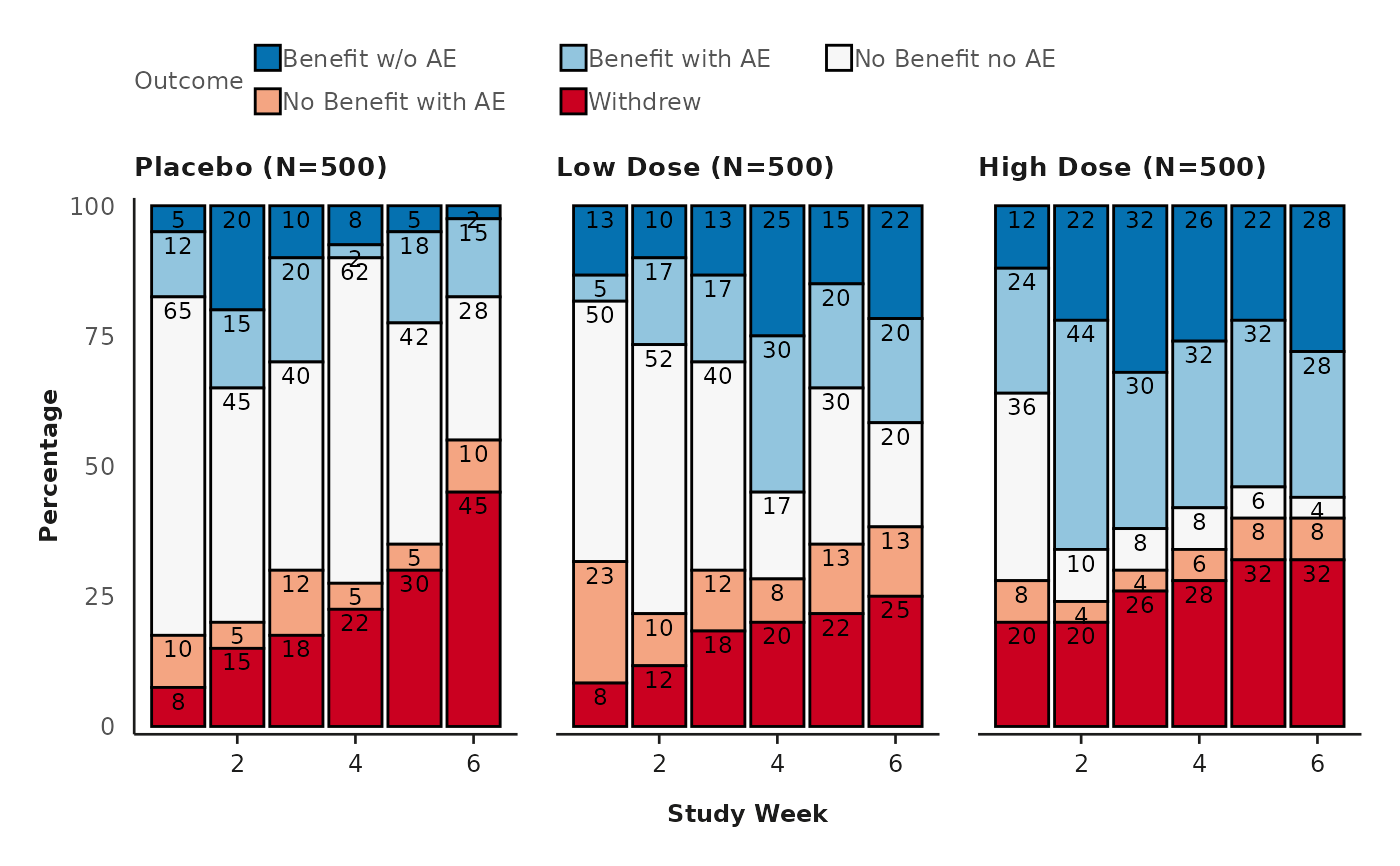 # unequal number of observations across visits
comp_outcome3 <- comp_outcome[!(comp_outcome$trtn == 1 &
comp_outcome$usubjid %in% c(1:40) & comp_outcome$visit == 5), ]
stacked_barchart(
data = comp_outcome3,
chartcolors = colfun()$fig12_colors,
xlabel = "Study Week"
)
#> Warning: You have unequal number of observations across visits, please check missing data.
# unequal number of observations across visits
comp_outcome3 <- comp_outcome[!(comp_outcome$trtn == 1 &
comp_outcome$usubjid %in% c(1:40) & comp_outcome$visit == 5), ]
stacked_barchart(
data = comp_outcome3,
chartcolors = colfun()$fig12_colors,
xlabel = "Study Week"
)
#> Warning: You have unequal number of observations across visits, please check missing data.