Line Chart
line_chart(
  func,
  data_bands,
  data_lines,
  show_bands = "Y",
  show_points = "N",
  line_size = 0.6,
  line_type = "solid",
  xmin,
  xmax,
  ymin,
  ymax,
  xbreaks,
  ybreaks,
  xlab,
  ylab,
  legend_title
)
Arguments
- func
the name of a function, or a call or an expression written as a function of x
- data_bands
(
data.frame) a data frame with 3 variables named the following:level: level each band represents
ystart: starting point of each band
yend: ending point of each band
col: color of each band
- data_lines
(
data.frame) a data frame with 7 variables named the following:stage: stage each line represents
xstart: x-axis starting point of each line
xend: x-axis ending point of each line
y: y-axis position of each line
col: color of each line
xpos: x-axis position of each annotation (relative to xstart)
ypos: y-axis position of each annotation (relative to y)
- show_bands
(
character) a logical value indicating whether to show bands in the plot (Y, N)- show_points
(
character) a logical value indicating whether to show points at the start of the arrows (Y, N)- line_size
(
numeric) size of the line- line_type
(
character) type of the line- xmin
(
numeric) starting point of x axis- xmax
(
numeric) ending point of x axis- ymin
(
numeric) starting point of y axis- ymax
(
numeric) ending point of y axis- xbreaks
(
numeric) x axis breaks- ybreaks
(
numeric) y axis breaks- xlab
(
character) x axis label- ylab
(
character) y axis label- legend_title
(
character) legend title
Value
a ggplot object
Examples
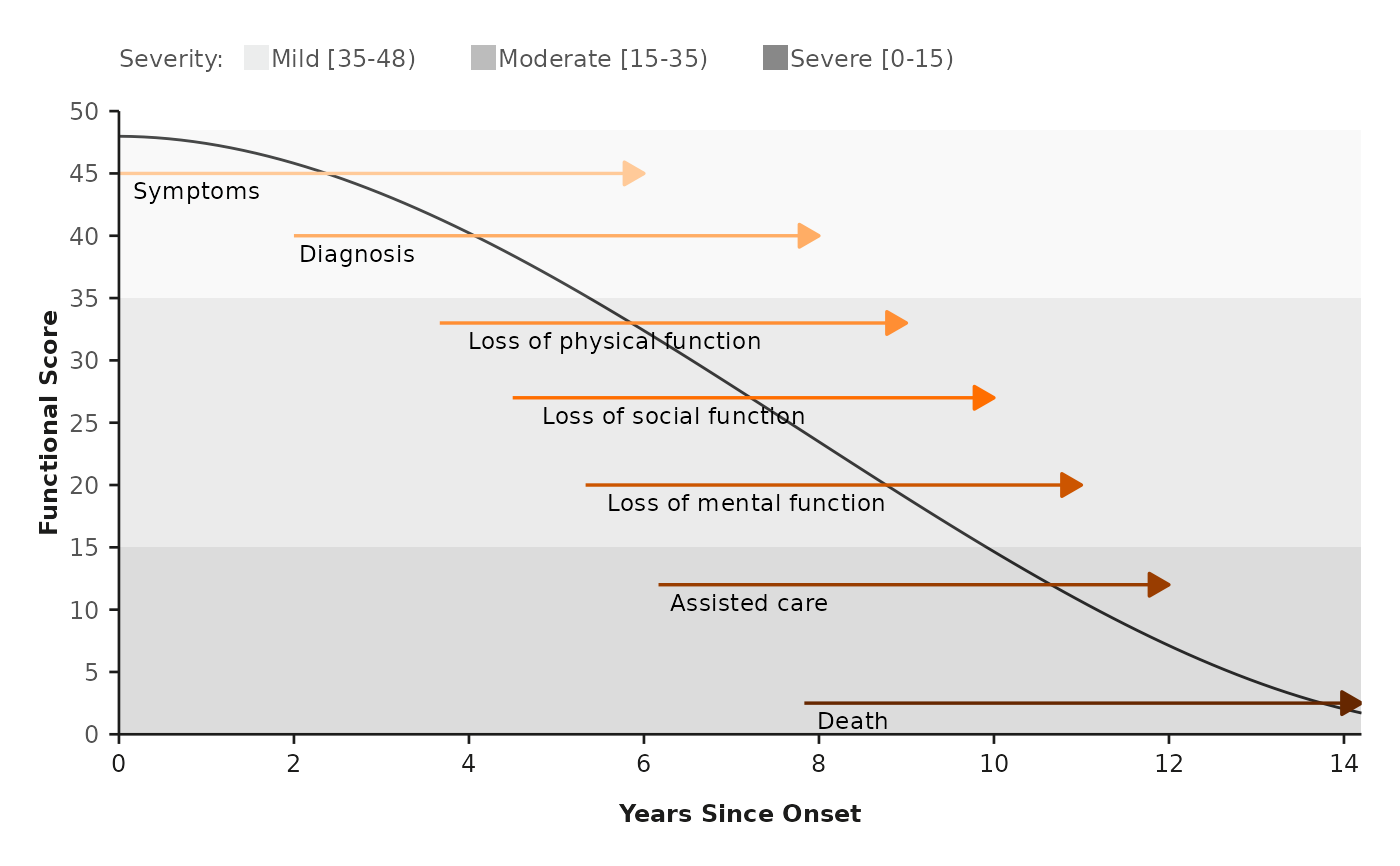
func <- function(x) 47.982 - 0.0305 * x - 0.57525 * x^2 + 0.0245 * x^3

line_chart(
  func = func,
  data_bands = data_bands,
  data_lines = data_lines,
  xmin = 0,
  xmax = 14.2,
  ymin = 0,
  ymax = 50,
  xbreaks = seq(0, 14, 2),
  ybreaks = seq(0, 50, 5),
  xlab = "Years Since Onset",
  ylab = "Functional Score",
  legend_title = "Severity: "
)
#> Scale for x is already present.
#> Adding another scale for x, which will replace the existing scale.