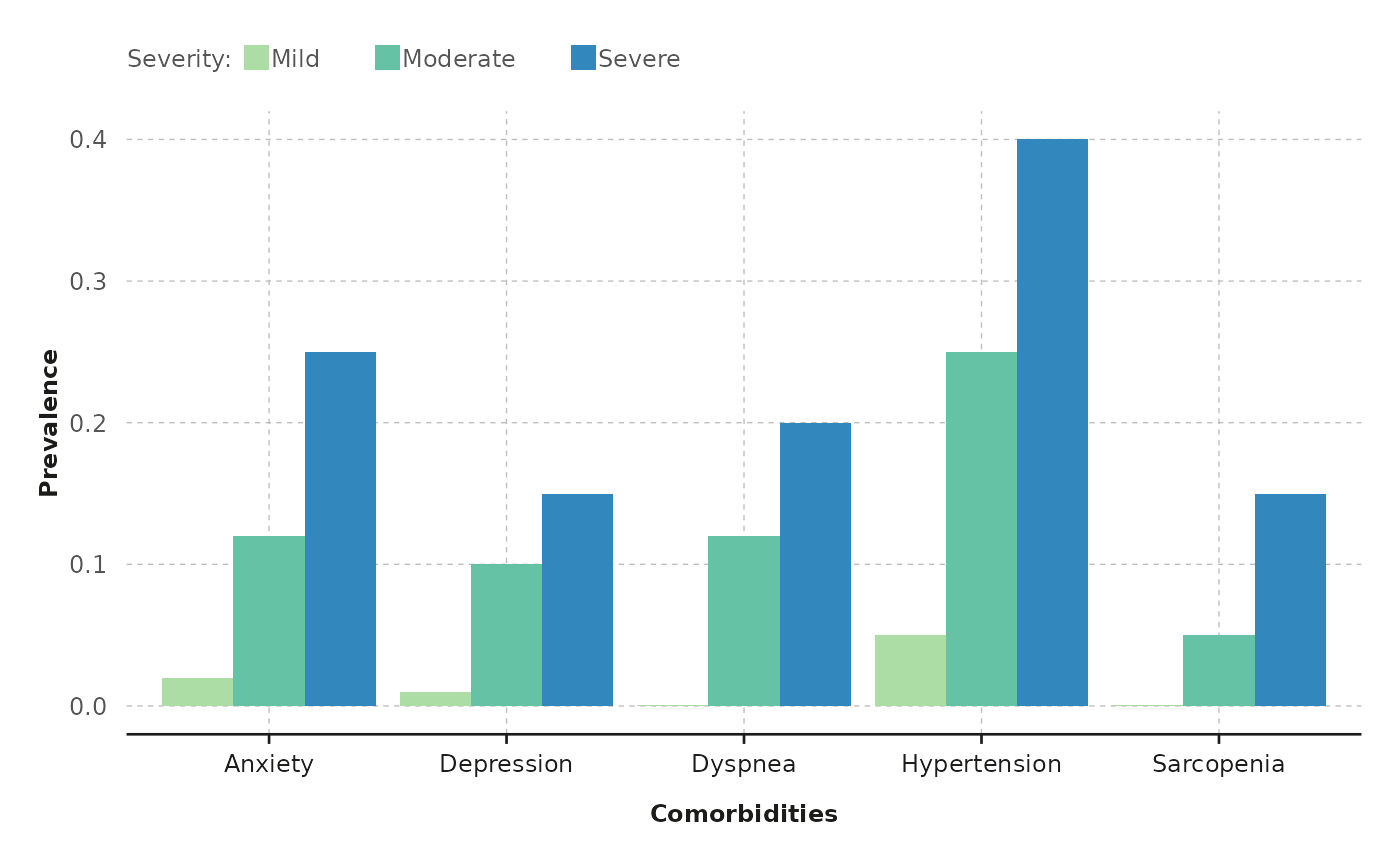
This function generates a grouped bar chart using ggplot2, where bars are grouped by a specified variable.
grouped_barchart(data, xvar, yvar, groupvar, chartcolors)Arguments
- data
A data frame containing at least 3 variables: x-axis variable, y-axis variable, and a grouping variable.
- xvar
A string specifying the name of the variable to be plotted on the x-axis.
- yvar
A string specifying the name of the variable to be plotted on the y-axis.
- groupvar
A string specifying the name of the grouping variable.
- chartcolors
A vector of colors with the same length as the number of levels in the grouping variable.
Value
A ggplot object representing the grouped bar chart.
Details
The function creates a bar chart where bars are grouped based on the specified grouping variable. It uses position = "dodge" to place bars side by side within each group. The y-axis line, minor grid lines, and y-axis ticks are removed for a cleaner appearance.
Note
This function requires the ggplot2 package and assumes the existence of a custom theme function br_charts_theme().
Examples
# Assuming 'comorbidities' is a data frame with appropriate columns
# and 'colfun()$fig4_colors' returns a vector of colors
grouped_barchart(
  data = comorbidities,
  xvar = "Comorbidities",
  yvar = "Prevalence",
  groupvar = "Severity",
  chartcolors = colfun()$fig4_colors
)