Trade-off plot
generate_tradeoff_plot.RdGenerate trade-off plot
generate_tradeoff_plot(
  data,
  filter,
  category,
  benefit,
  risk,
  type_risk,
  type_graph,
  ci,
  ci_method,
  cl,
  mab,
  mar,
  threshold,
  ratio,
  b1,
  b2,
  b3,
  b4,
  b5,
  b6,
  b7,
  b8,
  b9,
  b10,
  r1,
  r2,
  r3,
  r4,
  r5,
  r6,
  r7,
  r8,
  r9,
  r10,
  testdrug,
  type_scale,
  lower_x,
  upper_x,
  lower_y,
  upper_y,
  chartcolors
)
Arguments
- data
(
data.frame) input dataset The following variables are required columns. Note that the variablesGrouped_Outcome,Statistics, andOutcome_Statusare not required for generating a trade-off plot, but are listed as required columns because they are key for generating a value tree, which is a starting point for all subsequent benefit-risk assessments.Factor: A character vector containing whether an outcome is a "Benefit" or a "Risk"
Grouped_Outcome: A character vector containing the name of grouped outcomes, e.g., Infections
Outcome: A character vector containing the name of outcomes, e.g., Herpes viral infections, upper respiratory tract infections
Statistics: A character vector containing the summary statistics of outcomes, e.g., %, mean change from baseline
Type: A character vector containing whether an outcome is a "Binary" or a "Continuous" variable
Outcome_Status: A character vector containing whether an outcome is an "Identified" or a "Potential" outcome
Filter: A character vector containing the filter for subgroup data, should be "None" if no filtre is applicable. Example: None; Sex.
Category: A character vector containing the category for filtering subgroup data, should be "All" if no filter is applicable. Example: All; Male, Female.
Trt1: A character vector containing the name of active treatments
Trt2: A character vector containing controlled term "Placebo"
Drug_Status: A character vector containing whether a treatment is an "Approved" or a "Test" drug The following variables are situational columns - Filled in only for the specific summary statistic related to the row outcome (ex. proportion):
Rate_Type: A numeric vector containing whether an AE rate is "EventRate" or "IncRate". Required for risk outcomes displayed in exposure-adjusted event rate or incidence rate.
Prop1: A numeric vector containing the proportion in active treatment. Required for binary outcomes displayed in proportions; can be populated by nSub1/N1 if both nSub1 and N1 are provided.
IncRate1: A numeric vector containing the exposure-adjusted incidence rate per 100 PYs in active treatment. Required for risk outcomes displayed in exposure-adjusted incidence rates; can be populated by nSub1/PYAR1*100 if both nSub1 and PYAR1 are provided.
EventRate1: A numeric vector containing the exposure-adjusted event rate per 100 PYs in active treatment. Required for risk outcomes displayed in exposure-adjusted event rates; can be populated by nEvent1/PEY1*100 if both nEvent1 and PEY1 are provided.
Mean1: A numeric vector containing the mean in active treatment. Required for continuous outcomes.
Prop2: A numeric vector containing the proportion in comparator treatment. Required for binary outcomes displayed in proportions; can be populated by nSub2/N2 if both nSub1 and N1 are provided.
IncRate2: A numeric vector containing the exposure-adjusted incidence rate per 100 PYs in comparator treatment. Required for risk outcomes displayed in exposure-adjusted incidence rates; can be populated by nSub2/PYAR2*100 if both nSub1 and PYAR1 are provided.
EventRate2: A numeric vector containing the exposure-adjusted event rate per 100 PYs in comparator treatment. Required for risk outcomes displayed in exposure-adjusted event rates; can be populated by nEvent2/PEY2*100 if both nEvent1 and PEY1 are provided.
Mean2: A numeric vector containing the mean in comparator treatment. Required for continuous outcomes. The following variables are optional columns - Can be either hand entered or calculated by the package (ex. confidence intervals):
N1: An integer vector containing the total number of subjects in active treatment. Required when needing to calculate confidence intervals within the package for proportions.
100PYAR1: A numeric vector containing 100 patient-years at risk in active treatment. Required when needing to calculate confidence intervals within the app for exposure-adjusted incidence rates.
100PEY1: A vector containing 100 patient-years of exposure in active treatment. Required when needing to calculate confidence intervals within the app for exposure-adjusted event rates.
Sd1: A numeric vector containing the standard deviation in active treatment. Required when needing to calculate confidence intervals within the app for continuous outcomes; can be populated by Se1/SQRT(N1) if Se1 and N1 are provided.
N2: An integer vector containing the total number of subjects in comparator treatment. Required when needing to calculate confidence intervals within the package for proportions.
100PYAR2: A numeric vector containing 100 patient-years at risk in comparator treatment. Required when needing to calculate confidence intervals within the app for exposure-adjusted incidence rates.
100PEY2: A numeric vector containing 100 patient-years of exposure in comparator treatment. Required when needing to calculate confidence intervals within the app for exposure-adjusted event rates.
Sd2: A numeric vector containing the standard deviation in comparator treatment. Required when needing to calculate confidence intervals within the app for continuous outcomes; can be populated by Se2/SQRT(N2) if Se2 and N2 are provided.
Diff_LowerCI: A numeric vector containing the lower confidence interval for difference in proportions and continuous outcomes. Required when using supplied confidence intervals for difference in proportions and continuous outcomes.
Diff_UpperCI: A numeric vector containing the upper confidence interval for difference in proportions and continuous outcomes. Required when using supplied confidence intervals for difference in proportions and continuous outcomes.
Diff_IncRate_LowerCI: A numeric vector containing the lower confidence interval for difference in exposure-adjusted incidence rates. Required when using supplied confidence intervals for difference in exposure-adjusted incidence rates.
Diff_IncRate_UpperCI: A numeric vector containing the upper confidence interval for difference in exposure-adjusted incidence rates. Required when using supplied confidence intervals for difference in exposure-adjusted incidence rates.
Diff_EventRate_LowerCI: A numeric vector containing the lower confidence interval for difference in exposure-adjusted event rates. Required when using supplied confidence intervals for difference in exposure-adjusted event rates.
Diff_EventRate_UpperCI: A numeric vector containing the upper confidence interval for difference in exposure-adjusted event rates. Required when using supplied confidence intervals for difference in exposure-adjusted event rates.
RelRisk_LowerCI: A numeric vector containing the lower confidence interval for relative risk of binary outcomes. Required when using supplied confidence intervals for relative risk of binary outcomes.
RelRisk_UpperCI: A numeric vector containing the upper confidence interval for relative risk of binary outcomes. Required when using supplied confidence intervals for relative risk of binary outcomes.
OddsRatio_LowerCI: A numeric vector containing the lower confidence interval for odds ratio of binary outcomes. Required when using supplied confidence intervals for odds ratio of binary outcomes.
OddsRatio_UpperCI: A numeric vector containing the upper confidence interval for odds ratio of binary outcomes. Required when using supplied confidence intervals for odds ratio of binary outcomes. The following variables are supplementary columns - Used to calculate other columns are not required by the package(ex. number of subjects with events):
nSub1: An integer vector containing the number of subjects with events in active treatment. Not required; can be used to calculate Prop1 by nSub1/N1.
Dur1: A numeric vector containing the duration of treatment in active treatment. Not required; can be used to estimate 100PYAR1 and 100PEY1.
nEvent1: An integer vector containing the number of events in active treatment. Not required; can be used to calculate EventRate1 by nEvent1/100PEY1.
Se1: A numeric vector containing the standard error in active treatment. Not required; can be used to calculate Sd1 by Se1*SQRT(N1).
nSub2: An integer vector containing the number of subjects with events in comparator treatment. Not required; can be used to calculate Prop2 by nSub2/N2.
Dur2: A numeric vector containing the duration of treatment in comparator treatment. Not required; can be used to estimate 100PYAR2 and 100PEY2.
nEvent2: An integer vector containing the number of events in comparator treatment. Not required; can be used to calculate EventRate2 by nEvent2/100PEY2.
Se2: A numeric vector containing the standard error in comparator treatment. Not required; can be used to calculate Sd2 by Se2*SQRT(N2). The following variables are documentation columns - Record the data source (ex. Study xyz, Table 1.2.3, date):
MCDA_Weight: A numeric vector containing the MCDA weight
Population: A character vector containing the population for the analysis (e.g., ITT, Safety Set)
Data_Source: A character vector containing the source of data (e.g., Reference CSR Table xxx)
Quality: A character vector containing the quality of data
Notes: A character vector containing notes
- filter
(
character) selected filter- category
(
character) selected category- benefit
(
character) selected benefit outcome- risk
(
character) selected risk outcome- type_risk
(
character) selected way to display risk outcomes (crude proportions, Exposure-adjusted rates (per 100 PYs))- type_graph
(
character) selected way to display binary outcomes (Absolute risk, Relative risk, Odds ratio)- ci
(
character) selected choice to display confidence intervals or not (Yes, No)- ci_method
(
character) selected method to display confidence intervals (Supplied, Calculated)- cl
(
numeric) confidence level- mab
(
numeric) specified minimum acceptable benefit- mar
(
numeric) specified maximum acceptable risk- threshold
(
character) selected way to set benefit-risk threshold (None, Straight line, Segmented line, Smooth curve)- ratio
(
numeric) specified maximum acceptable ratio between risk and benefit- b1, b2, b3, b4, b5, b6, b7, b8, b9, b10
(
numeric) specified benefit- r1, r2, r3, r4, r5, r6, r7, r8, r9, r10
(
numeric) specified risk tolerance- testdrug
(
character) selected choice to display test drug or not (Yes, No)- type_scale
(
character) selected scale display type (Fixed, Free)- lower_x, upper_x, lower_y, upper_y
(
numeric) specified axis limits- chartcolors
(
vector) a vector of colors, the same number of levels as the number of treatments
Value
a ggplot object
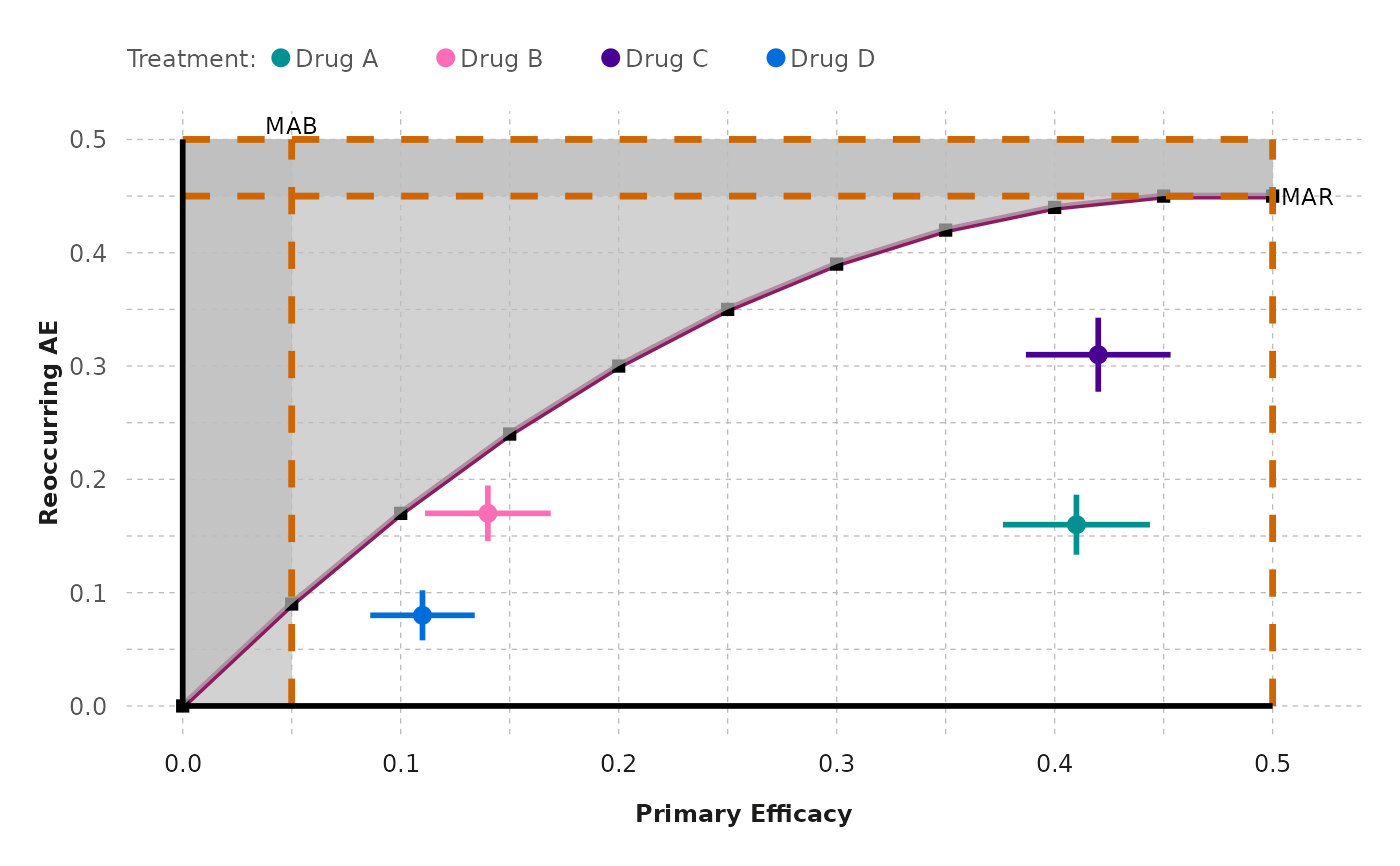
Examples
generate_tradeoff_plot(
  data = effects_table, filter = "None", category = "All",
  benefit = "Primary Efficacy", risk = "Reoccurring AE",
  type_risk = "Crude proportions", type_graph = "Absolute risk",
  ci = "Yes", ci_method = "Calculated", cl = 0.95,
  mab = 0.05,
  mar = 0.45,
  threshold = "Segmented line",
  ratio = 4,
  b1 = 0.05,
  b2 = 0.1,
  b3 = 0.15,
  b4 = 0.2,
  b5 = 0.25,
  b6 = 0.3,
  b7 = 0.35,
  b8 = 0.4,
  b9 = 0.45,
  b10 = 0.5,
  r1 = 0.09,
  r2 = 0.17,
  r3 = 0.24,
  r4 = 0.3,
  r5 = 0.35,
  r6 = 0.39,
  r7 = 0.42,
  r8 = 0.44,
  r9 = 0.45,
  r10 = 0.45,
  testdrug = "Yes",
  type_scale = "Free",
  lower_x = 0,
  upper_x = 0.5,
  lower_y = 0,
  upper_y = 0.5,
  chartcolors = colfun()$fig7_colors
)
#> [2024-08-25 14:26:15] >
#> absolute risk CI for binary outcomes is calculated and saved
#> [2024-08-25 14:26:15] >
#> absolute risk CI for binary outcomes is calculated and saved
#> [2024-08-25 14:26:15] > prepare tradeoff data
#> [2024-08-25 14:26:15] > prepare trade-off plot
#> [2024-08-25 14:26:15] > update final trade-off plot