Pyramid Chart
pyramid_chart.RdPyramid Chart
pyramid_chart(
  data,
  xvar,
  yvar,
  levelvar,
  groupvar,
  xlab,
  alpha_set,
  chartcolors
)
Arguments
- data
dataframedemography data- xvar
valuex-axis- yvar
valuey-axis- levelvar
Factortwo factor levels, one for each pyramid- groupvar
Factortwo factor levels, one for each side of a pyramid- xlab
textfor x-axis label- alpha_set
Valuespecify transparency of symbols- chartcolors
vectortwo colors, one for each side of a pyramid
Value
ggplot object
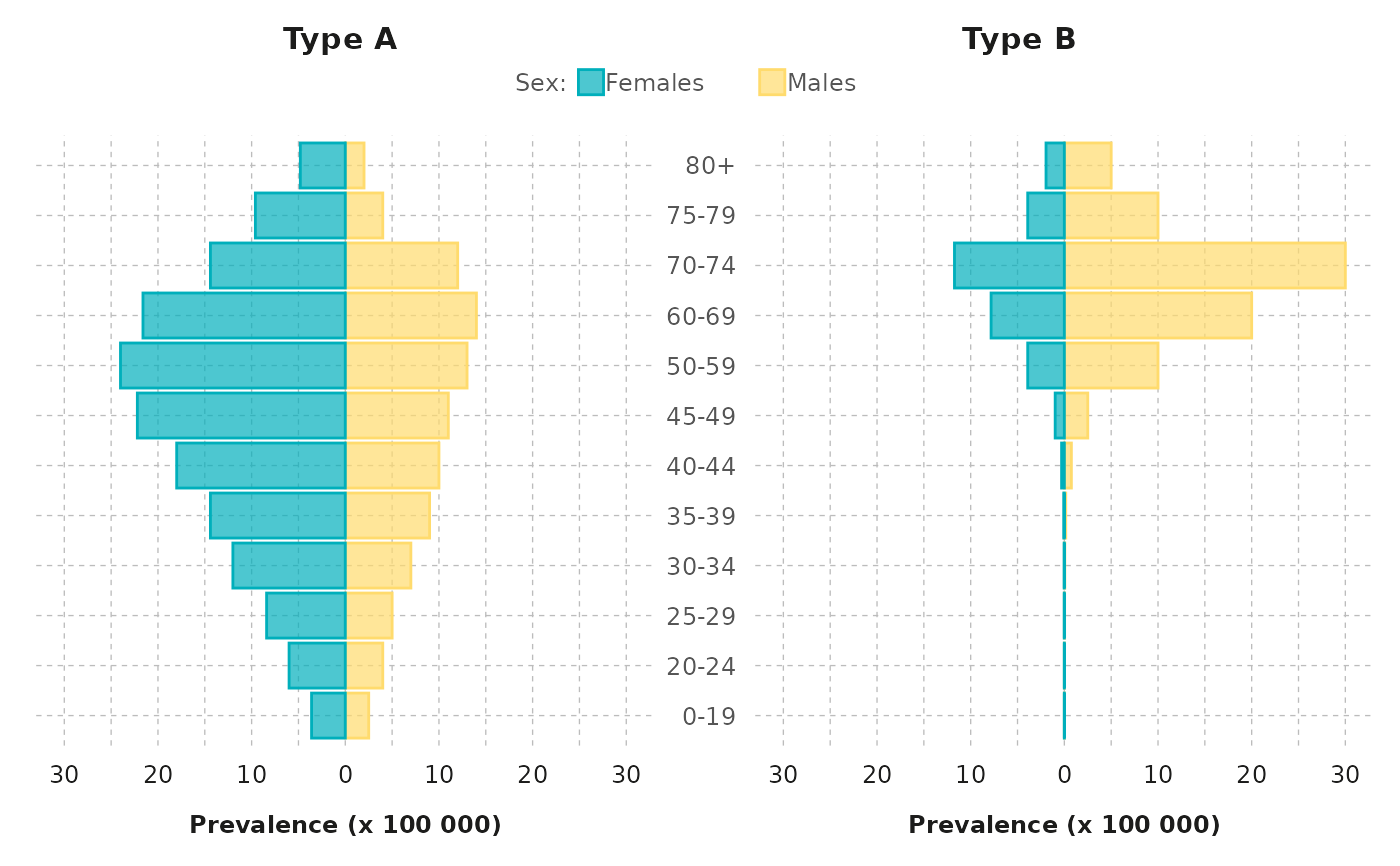
Examples
demography |>
  dplyr::mutate(
    Type = as.factor(paste0("Type ", Type)),
    figprev = ifelse(
      Gender == "Females", -1 * Prevalence / 100000, Prevalence / 100000
    ),
    Sex = Gender
  ) |>
  pyramid_chart(
    levelvar = "Type", xvar = "figprev", yvar = "Age",
    groupvar = "Sex", alpha_set = 0.7, chartcolors = colfun()$fig2_colors,
    xlab = "Prevalence (x 100 000)"
  )