Dot plot
generate_fig_lft.RdCreate Dot plot
generate_fig_lft(
  data,
  fact_subset = "Benefit",
  type_subset = "Binary",
  type_scale = "Fixed",
  x_scale_n1_p1 = "N",
  xlabel = NULL,
  ylabel = NULL,
  select_nnx
)
Arguments
- data
(
character) Data for figure- fact_subset
(
character) filter data- type_subset
(
character) Selected subset "Binary" or "Continuous"- type_scale
(
character) selected scale display type- x_scale_n1_p1
(
character) fix x-axis scale between 0 and 1- xlabel
(
character) Label for x-axis- ylabel
(
character) Label for y-axis- select_nnx
(
character) show NNT/NNH
Examples
dot_plot_src <- subset(effects_table, !is.na(Prop1))
bdin <- subset(dot_plot_src, Factor == "Benefit")
rdin <- subset(dot_plot_src, Factor == "Risk")
fplot_data <- prepare_dot_forest_plot_data(
data = dot_plot_src,
drug = unique(dot_plot_src$Trt1),
benefit = unique(bdin$Outcome),
risk = unique(rdin$Outcome),
filters = "None",
category = "All",
type_graph = "Absolute risk",
type_risk = "Crude proportions",
ci_method = "Calculated"
)
#> [2024-08-08 10:28:42] > Prepare Dot plot data for binary outcomes
#> [2024-08-08 10:28:42] > trigger analysis based on type
#> [2024-08-08 10:28:42] >
#> absolute risk CI for binary outcomes is calculated and saved
#> [2024-08-08 10:28:42] > Prepare Forest plot data for absolute risk
#> [2024-08-08 10:28:42] > Prepare Dot plot data for binary outcomes
#> [2024-08-08 10:28:42] > trigger analysis based on type
#> [2024-08-08 10:28:42] >
#> absolute risk CI for binary outcomes is calculated and saved
#> [2024-08-08 10:28:42] > Prepare Forest plot data for absolute risk
#> [2024-08-08 10:28:42] > Dataout object from the create_order_label_der function is created
#> [2024-08-08 10:28:42] > Prepare data for Dot and Forest plots
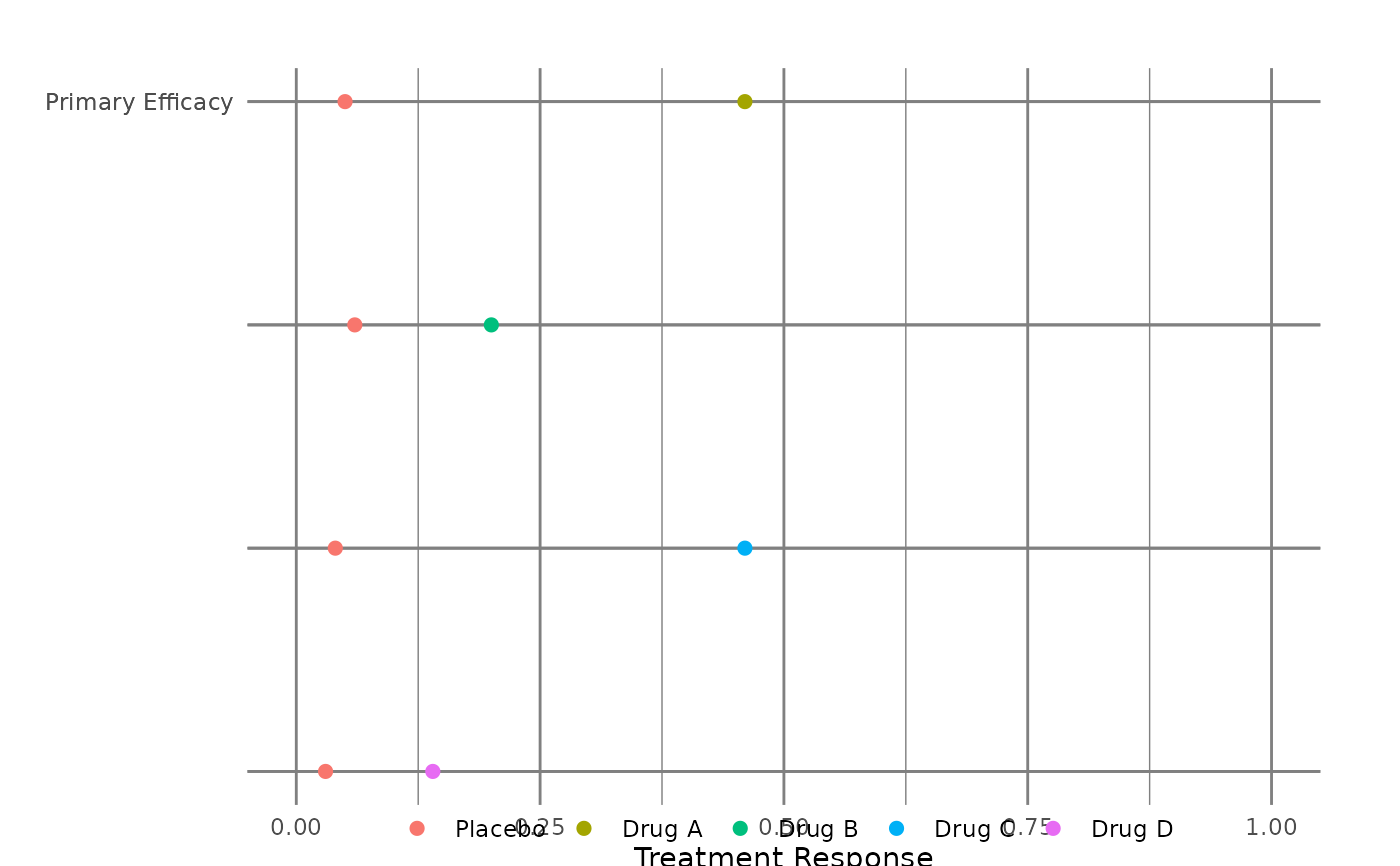
generate_fig_lft(fplot_data$dot_plot_data,
fact_subset = "Benefit",
type_subset = "Binary",
xlabel = "Treatment Response",
select_nnx = "Yes"
)
#> Scale for x is already present.
#> Adding another scale for x, which will replace the existing scale.
#> [2024-08-08 10:28:42] > Create Dot plot