Grouped Bar Chart
grouped_barchart.RdGrouped Bar Chart
grouped_barchart(data, xvar, yvar, groupvar, chartcolors)Arguments
Value
a ggplot object
Examples
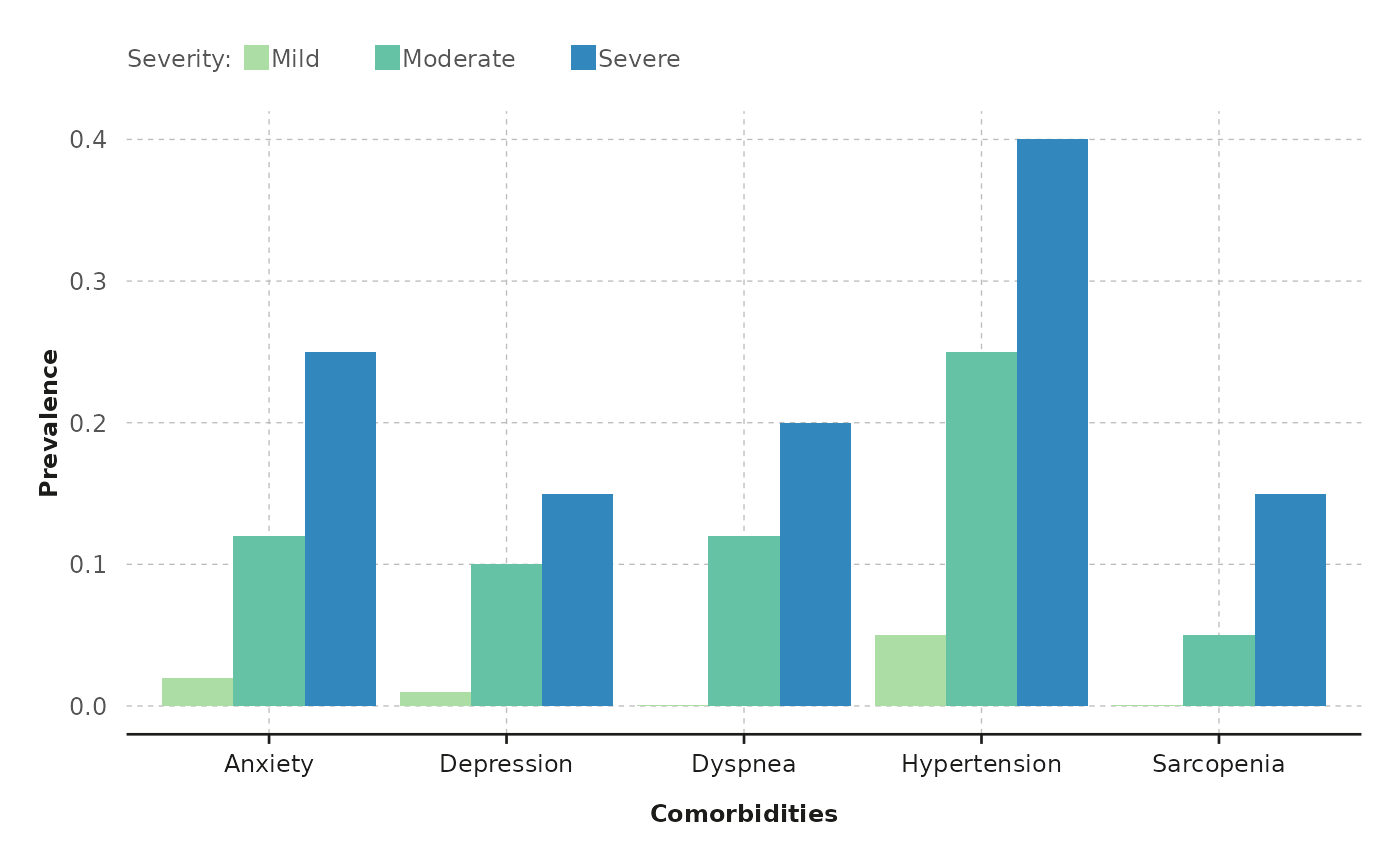
grouped_barchart(
  data = comorbidities, xvar = "Comorbidities",
  yvar = "Prevalence", groupvar = "Severity",
  chartcolors = colfun()$fig4_colors
)