Dot and Forest plots
create_dot_forest_plot.RdCreate Dot and Forest plots and associated data
create_dot_forest_plot(
  data,
  drug,
  benefit,
  risk,
  filters,
  category,
  type_graph,
  type_risk,
  select_nnx,
  x_scale_fixed_free,
  ci_method,
  space_btwn_out_yn = "Y"
)
Arguments
- data
(
data.frame) dataset- drug
(
character) selected drug- benefit
(
character) selected benefit- risk
(
character) selected risk- filters
(
character) selected filter- category
(
character) selected category- type_graph
(
character) selected way to display binary outcomes- type_risk
(
character) selected way to display risk outcomes (crude proportions, exposure-adjusted rates (per 100 PYs))- select_nnx
(
character) show NNT/NNH- x_scale_fixed_free
(
character) free or fixed x-axis scale- ci_method
(
character) selected method to display- space_btwn_out_yn
(
character) control spacing between outcomes confidence intervals (Supplied in effects table, Calculated within the program)
Examples
dot_plot_src <- subset(effects_table, !is.na(Prop1))
bdin <- subset(dot_plot_src, Factor == "Benefit")
rdin <- subset(dot_plot_src, Factor == "Risk")
create_dot_forest_plot(
data = dot_plot_src,
drug = unique(dot_plot_src$Trt1),
benefit = unique(bdin$Outcome),
risk = unique(rdin$Outcome),
filters = "None",
category = "All",
type_graph = "Absolute risk",
type_risk = "Crude proportions",
select_nnx = "Y",
x_scale_fixed_free = "Fixed",
ci_method = "Calculated",
space_btwn_out_yn = "N"
)
#> [2024-07-17 15:32:12] > Prepare Dot plot data for binary outcomes
#> [2024-07-17 15:32:12] > trigger analysis based on type
#> [2024-07-17 15:32:12] >
#> absolute risk CI for binary outcomes is calculated and saved
#> [2024-07-17 15:32:12] > Prepare Forest plot data for absolute risk
#> [2024-07-17 15:32:12] > Prepare Dot plot data for binary outcomes
#> [2024-07-17 15:32:12] > trigger analysis based on type
#> [2024-07-17 15:32:12] >
#> absolute risk CI for binary outcomes is calculated and saved
#> [2024-07-17 15:32:12] > Prepare Forest plot data for absolute risk
#> [2024-07-17 15:32:12] > Dataout object from the create_order_label_der function is created
#> [2024-07-17 15:32:12] > Prepare data for Dot and Forest plots
#> [2024-07-17 15:32:12] > Create Dot plot
#> Scale for x is already present.
#> Adding another scale for x, which will replace the existing scale.
#> [2024-07-17 15:32:12] > Create Forest plot
#> [2024-07-17 15:32:12] > Create Dot plot
#> Scale for x is already present.
#> Adding another scale for x, which will replace the existing scale.
#> [2024-07-17 15:32:12] > Create Forest plot
#> [2024-07-17 15:32:12] > Create Dot and Forest plots and associated data
#> $myplot_lft0
#> NULL
#>
#> $myplot_rgt0
#> NULL
#>
#> $myplot_lft1
 #>
#> $myplot_rgt1
#>
#> $myplot_rgt1
 #>
#> $myplot_lft2
#>
#> $myplot_lft2
 #>
#> $myplot_rgt2
#>
#> $myplot_rgt2
 #>
#> $myplotdata1
#> # A tibble: 32 × 12
#> rate treatment type factor outcome group neword allobs mylab fobs
#> <dbl> <fct> <chr> <chr> <chr> <int> <dbl> <dbl> <chr> <dbl>
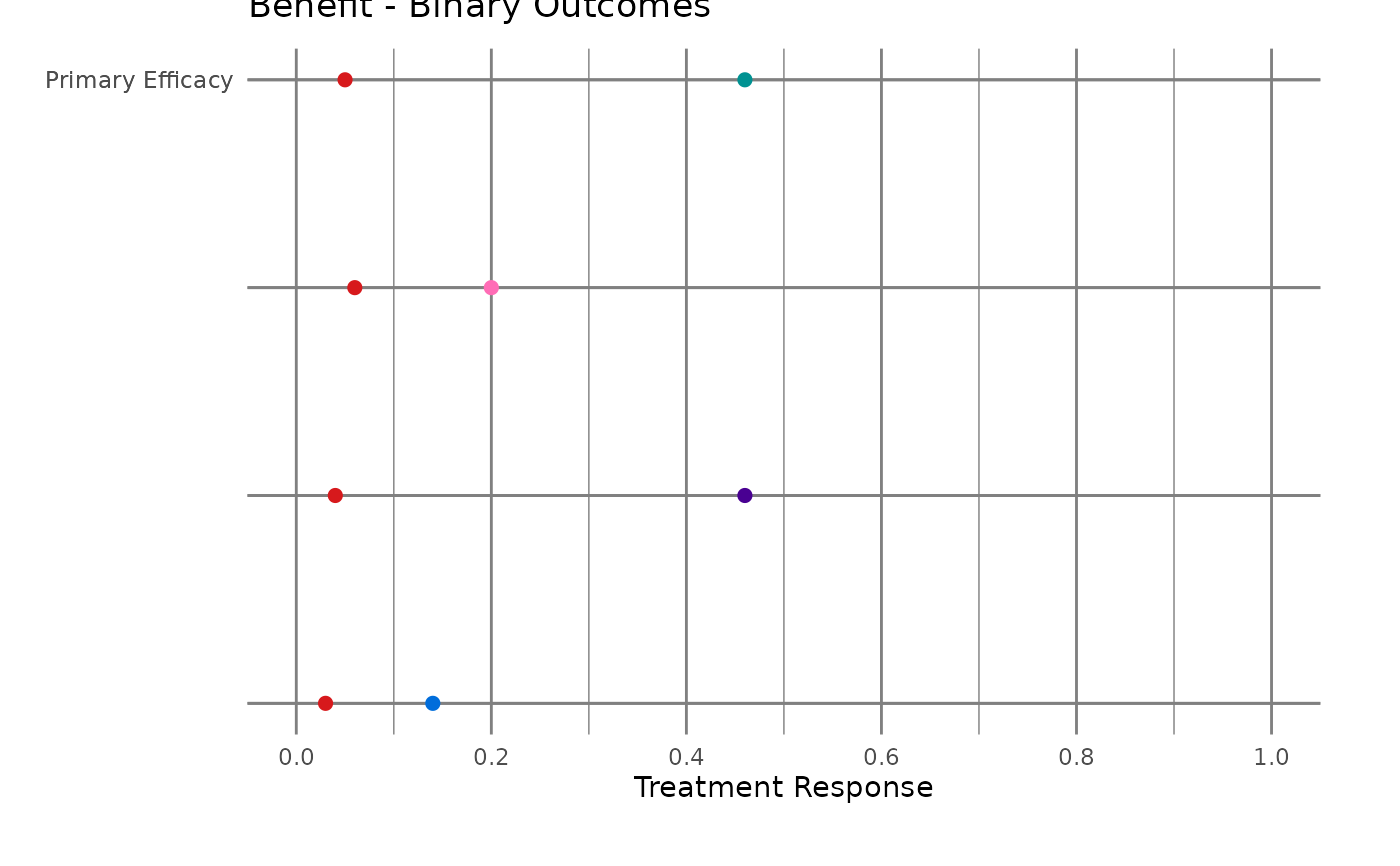
#> 1 0.46 Drug A Binary Benefit Primary Effic… 1 5 16 " … 4
#> 2 0.05 Placebo Binary Benefit Primary Effic… 1 5 16 " … 4
#> 3 0.2 Drug B Binary Benefit Primary Effic… 2 4 16 " … 4
#> 4 0.06 Placebo Binary Benefit Primary Effic… 2 4 16 " … 4
#> 5 0.46 Drug C Binary Benefit Primary Effic… 3 3 16 " … 4
#> 6 0.04 Placebo Binary Benefit Primary Effic… 3 3 16 " … 4
#> 7 0.14 Drug D Binary Benefit Primary Effic… 4 2 16 " … 4
#> 8 0.03 Placebo Binary Benefit Primary Effic… 4 2 16 " … 4
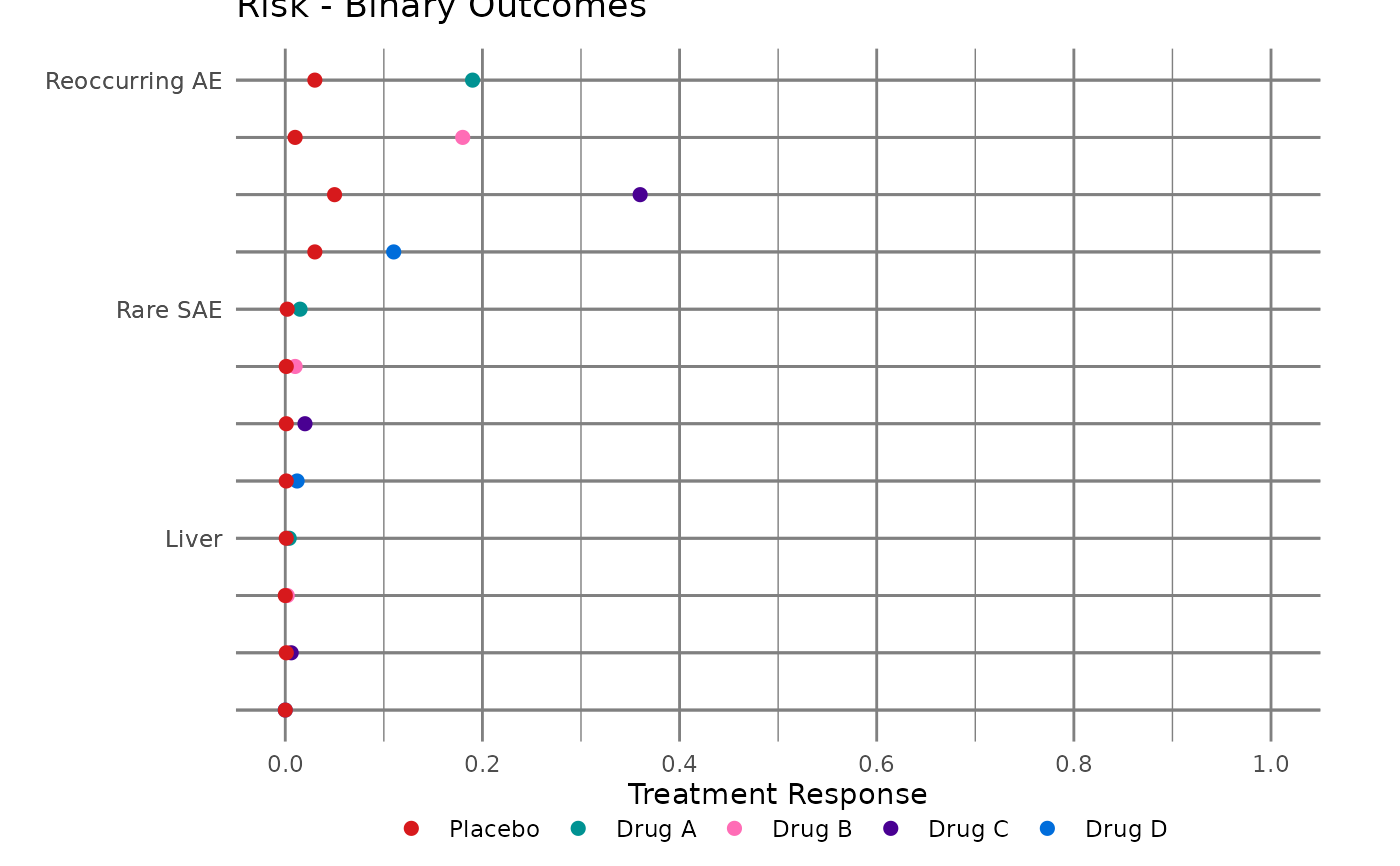
#> 9 0.19 Drug A Binary Risk Reoccurring AE 1 -2 16 " … 12
#> 10 0.03 Placebo Binary Risk Reoccurring AE 1 -2 16 " … 12
#> # ℹ 22 more rows
#> # ℹ 2 more variables: adjust_number <int>, mins_y <dbl>
#>
#> $myplotdata2
#> # A tibble: 16 × 16
#> treatment type factor outcome group neword allobs mylab fobs adjust_number
#> <fct> <chr> <chr> <chr> <int> <dbl> <dbl> <chr> <dbl> <int>
#> 1 Drug A Binary Benef… Primar… 1 5 16 " … 4 1
#> 2 Drug B Binary Benef… Primar… 2 4 16 " … 4 1
#> 3 Drug C Binary Benef… Primar… 3 3 16 " … 4 1
#> 4 Drug D Binary Benef… Primar… 4 2 16 " … 4 1
#> 5 Drug A Binary Risk Reoccu… 1 -2 16 " … 12 2
#> 6 Drug B Binary Risk Reoccu… 4 -3 16 " … 12 2
#> 7 Drug C Binary Risk Reoccu… 7 -4 16 " … 12 2
#> 8 Drug D Binary Risk Reoccu… 10 -5 16 " … 12 2
#> 9 Drug A Binary Risk Rare S… 2 -6 16 " … 12 3
#> 10 Drug B Binary Risk Rare S… 5 -7 16 " … 12 3
#> 11 Drug C Binary Risk Rare S… 8 -8 16 " … 12 3
#> 12 Drug D Binary Risk Rare S… 11 -9 16 " … 12 3
#> 13 Drug A Binary Risk Liver 3 -10 16 " … 12 4
#> 14 Drug B Binary Risk Liver 6 -11 16 " … 12 4
#> 15 Drug C Binary Risk Liver 9 -12 16 " … 12 4
#> 16 Drug D Binary Risk Liver 12 -13 16 " … 12 4
#> # ℹ 6 more variables: mins_y <dbl>, diff <dbl>, se <dbl>, lower <dbl>,
#> # upper <dbl>, Trt2 <chr>
#>
#>
#> $myplotdata1
#> # A tibble: 32 × 12
#> rate treatment type factor outcome group neword allobs mylab fobs
#> <dbl> <fct> <chr> <chr> <chr> <int> <dbl> <dbl> <chr> <dbl>
#> 1 0.46 Drug A Binary Benefit Primary Effic… 1 5 16 " … 4
#> 2 0.05 Placebo Binary Benefit Primary Effic… 1 5 16 " … 4
#> 3 0.2 Drug B Binary Benefit Primary Effic… 2 4 16 " … 4
#> 4 0.06 Placebo Binary Benefit Primary Effic… 2 4 16 " … 4
#> 5 0.46 Drug C Binary Benefit Primary Effic… 3 3 16 " … 4
#> 6 0.04 Placebo Binary Benefit Primary Effic… 3 3 16 " … 4
#> 7 0.14 Drug D Binary Benefit Primary Effic… 4 2 16 " … 4
#> 8 0.03 Placebo Binary Benefit Primary Effic… 4 2 16 " … 4
#> 9 0.19 Drug A Binary Risk Reoccurring AE 1 -2 16 " … 12
#> 10 0.03 Placebo Binary Risk Reoccurring AE 1 -2 16 " … 12
#> # ℹ 22 more rows
#> # ℹ 2 more variables: adjust_number <int>, mins_y <dbl>
#>
#> $myplotdata2
#> # A tibble: 16 × 16
#> treatment type factor outcome group neword allobs mylab fobs adjust_number
#> <fct> <chr> <chr> <chr> <int> <dbl> <dbl> <chr> <dbl> <int>
#> 1 Drug A Binary Benef… Primar… 1 5 16 " … 4 1
#> 2 Drug B Binary Benef… Primar… 2 4 16 " … 4 1
#> 3 Drug C Binary Benef… Primar… 3 3 16 " … 4 1
#> 4 Drug D Binary Benef… Primar… 4 2 16 " … 4 1
#> 5 Drug A Binary Risk Reoccu… 1 -2 16 " … 12 2
#> 6 Drug B Binary Risk Reoccu… 4 -3 16 " … 12 2
#> 7 Drug C Binary Risk Reoccu… 7 -4 16 " … 12 2
#> 8 Drug D Binary Risk Reoccu… 10 -5 16 " … 12 2
#> 9 Drug A Binary Risk Rare S… 2 -6 16 " … 12 3
#> 10 Drug B Binary Risk Rare S… 5 -7 16 " … 12 3
#> 11 Drug C Binary Risk Rare S… 8 -8 16 " … 12 3
#> 12 Drug D Binary Risk Rare S… 11 -9 16 " … 12 3
#> 13 Drug A Binary Risk Liver 3 -10 16 " … 12 4
#> 14 Drug B Binary Risk Liver 6 -11 16 " … 12 4
#> 15 Drug C Binary Risk Liver 9 -12 16 " … 12 4
#> 16 Drug D Binary Risk Liver 12 -13 16 " … 12 4
#> # ℹ 6 more variables: mins_y <dbl>, diff <dbl>, se <dbl>, lower <dbl>,
#> # upper <dbl>, Trt2 <chr>
#>