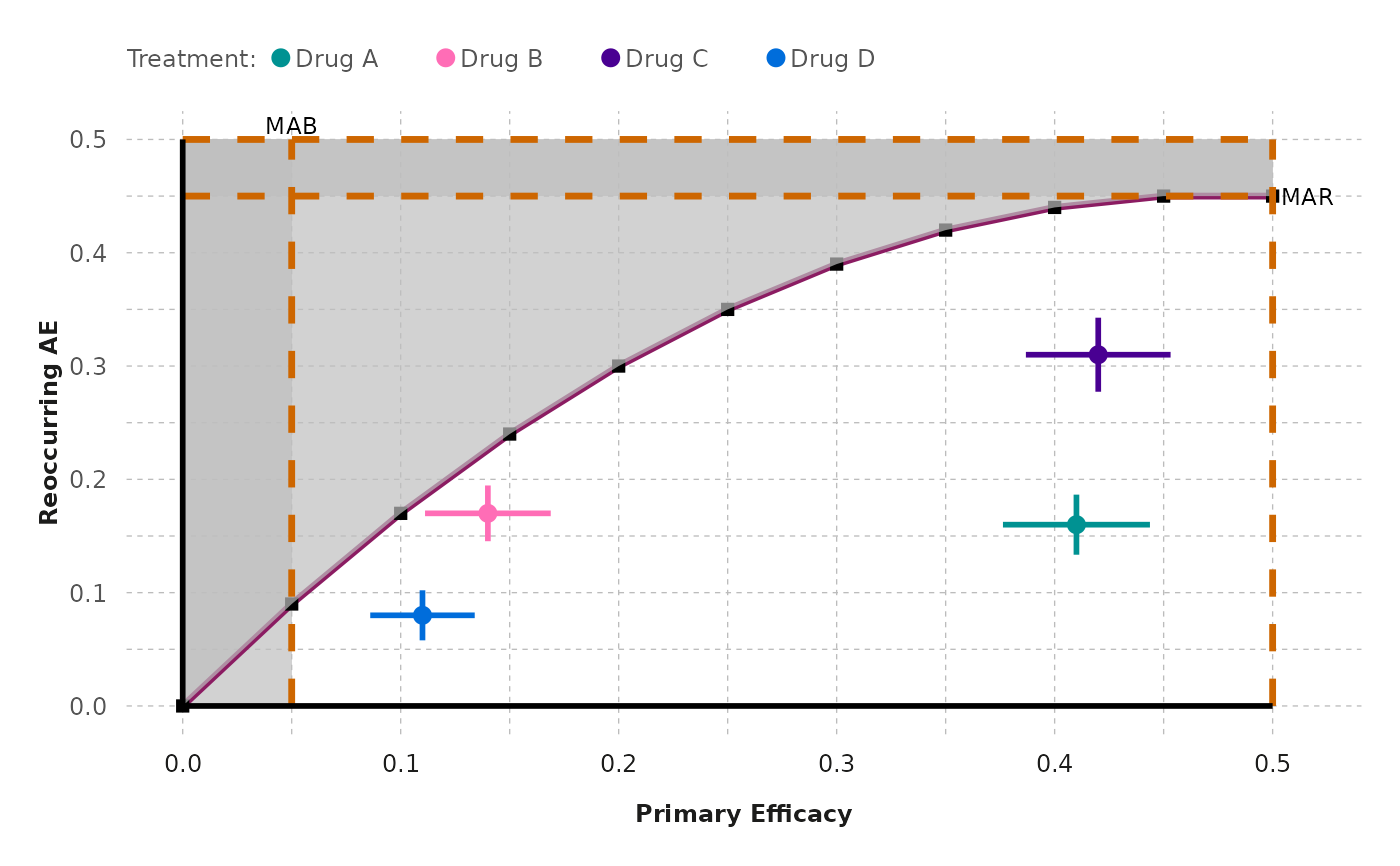
Trade-off plot
generate_tradeoff_plot.RdGenerate trade-off plot
generate_tradeoff_plot(
  data,
  filter,
  category,
  benefit,
  risk,
  type_risk,
  type_graph,
  ci,
  ci_method,
  cl,
  mab,
  mar,
  threshold,
  ratio,
  b1,
  b2,
  b3,
  b4,
  b5,
  b6,
  b7,
  b8,
  b9,
  b10,
  r1,
  r2,
  r3,
  r4,
  r5,
  r6,
  r7,
  r8,
  r9,
  r10,
  testdrug,
  type_scale,
  lower_x,
  upper_x,
  lower_y,
  upper_y,
  chartcolors
)
Arguments
- data
(
data.frame) input dataset- filter
(
character) selected filter- category
(
character) selected category- benefit
(
character) selected benefit outcome- risk
(
character) selected risk outcome- type_risk
(
character) selected way to display risk outcomes (crude proportions, Exposure-adjusted rates (per 100 PYs))- type_graph
(
character) selected way to display binary outcomes (Absolute risk, Relative risk, Odds ratio)- ci
(
character) selected choice to display confidence intervals or not (Yes, No)- ci_method
(
character) selected method to display confidence intervals (Supplied, Calculated)- cl
(
numeric) confidence level- mab
(
numeric) specified minimum acceptable benefit- mar
(
numeric) specified maximum acceptable risk- threshold
(
character) selected way to set benefit-risk threshold (None, Straight line, Segmented line, Smooth curve)- ratio
(
numeric) specified maximum acceptable ratio between risk and benefit- b1, b2, b3, b4, b5, b6, b7, b8, b9, b10
(
numeric) specified benefit- r1, r2, r3, r4, r5, r6, r7, r8, r9, r10
(
numeric) specified risk tolerance- testdrug
(
character) selected choice to display test drug or not (Yes, No)- type_scale
(
character) selected scale display type (Fixed, Free)- lower_x, upper_x, lower_y, upper_y
(
numeric) specified axis limits- chartcolors
(
vector) a vector of colors, the same number of levels as the number of treatments
Value
a ggplot object
Examples
generate_tradeoff_plot(
  data = effects_table, filter = "None", category = "All",
  benefit = "Primary Efficacy", risk = "Reoccurring AE",
  type_risk = "Crude proportions", type_graph = "Absolute risk",
  ci = "Yes", ci_method = "Calculated", cl = 0.95,
  mab = 0.05,
  mar = 0.45,
  threshold = "Segmented line",
  ratio = 4,
  b1 = 0.05,
  b2 = 0.1,
  b3 = 0.15,
  b4 = 0.2,
  b5 = 0.25,
  b6 = 0.3,
  b7 = 0.35,
  b8 = 0.4,
  b9 = 0.45,
  b10 = 0.5,
  r1 = 0.09,
  r2 = 0.17,
  r3 = 0.24,
  r4 = 0.3,
  r5 = 0.35,
  r6 = 0.39,
  r7 = 0.42,
  r8 = 0.44,
  r9 = 0.45,
  r10 = 0.45,
  testdrug = "Yes",
  type_scale = "Free",
  lower_x = 0,
  upper_x = 0.5,
  lower_y = 0,
  upper_y = 0.5,
  chartcolors = colfun()$fig7_colors
)
#> [2024-06-28 15:23:51] >
#> absolute risk CI for binary outcomes is calculated and saved
#> [2024-06-28 15:23:51] >
#> absolute risk CI for binary outcomes is calculated and saved
#> [2024-06-28 15:23:51] > prepare tradeoff data
#> [2024-06-28 15:23:51] > prepare trade-off plot
#> [2024-06-28 15:23:51] > update final trade-off plot
