Grouped Bar Chart
grouped_barchart.RdGrouped Bar Chart
grouped_barchart(data, xvar, yvar, groupvar, chartcolors)Arguments
- data
dataframeinput data- xvar
valuex-axis variable- yvar
valuey-axis variable- groupvar
Factorgroup variable- chartcolors
vectora vector of colors, the same number of levels as the group variable
Value
a ggplot object
Examples
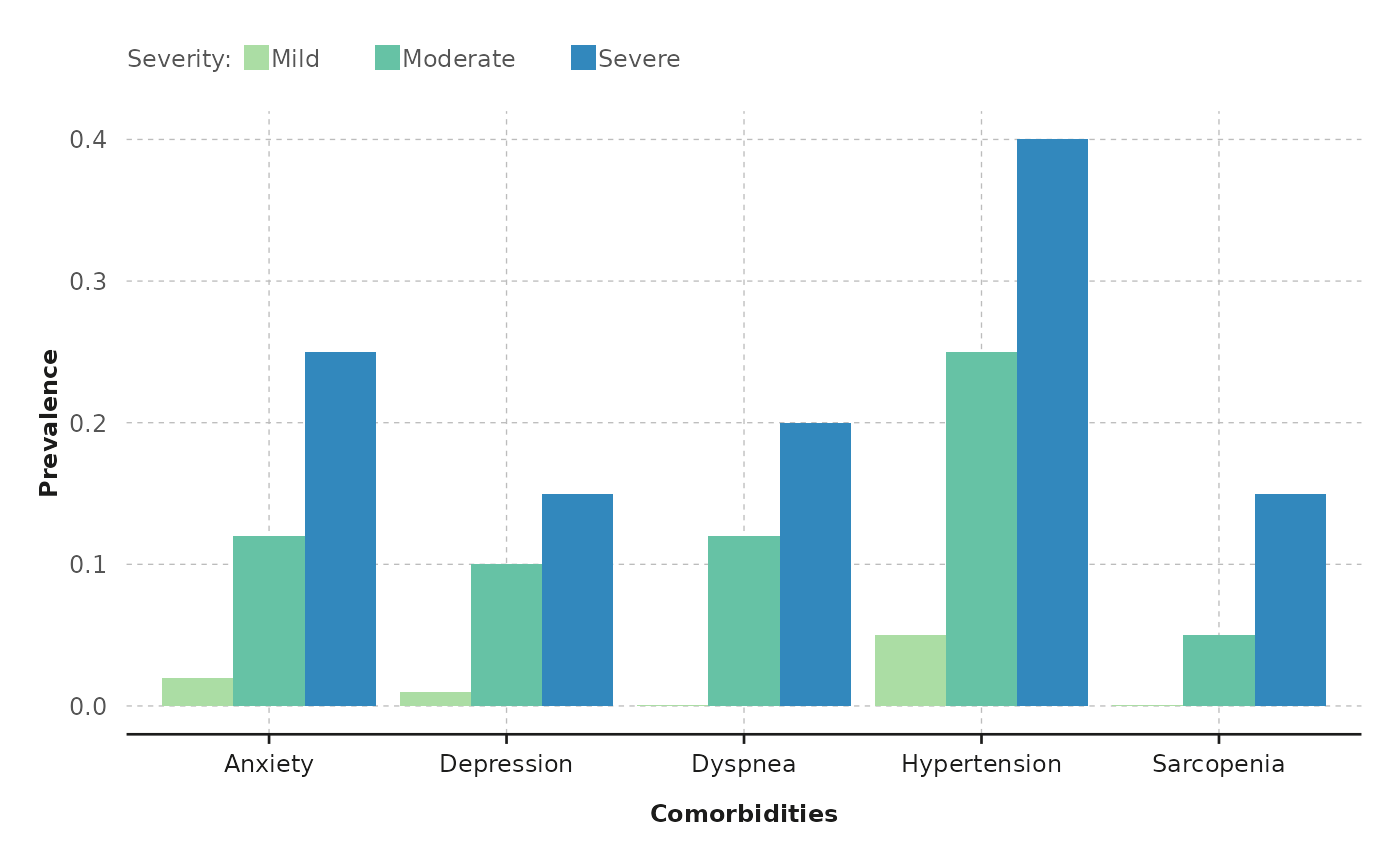
grouped_barchart(
  data = comorbidities, xvar = "Comorbidities",
  yvar = "Prevalence", groupvar = "Severity",
  chartcolors = colfun()$fig4_colors
)